Installation
To start reporting Kubernetes cluster metrics to AppSignal:1. Store your AppSignal API key in a secret
In a Kubernetes cluster, set up your AppSignal API key (find your Front-end API key in App settings) by creating a secret:2. Add AppSignal deployment to your cluster
Once you’ve created the AppSignal API key secret, add the AppSignal deployment to your cluster:Magic dashboard
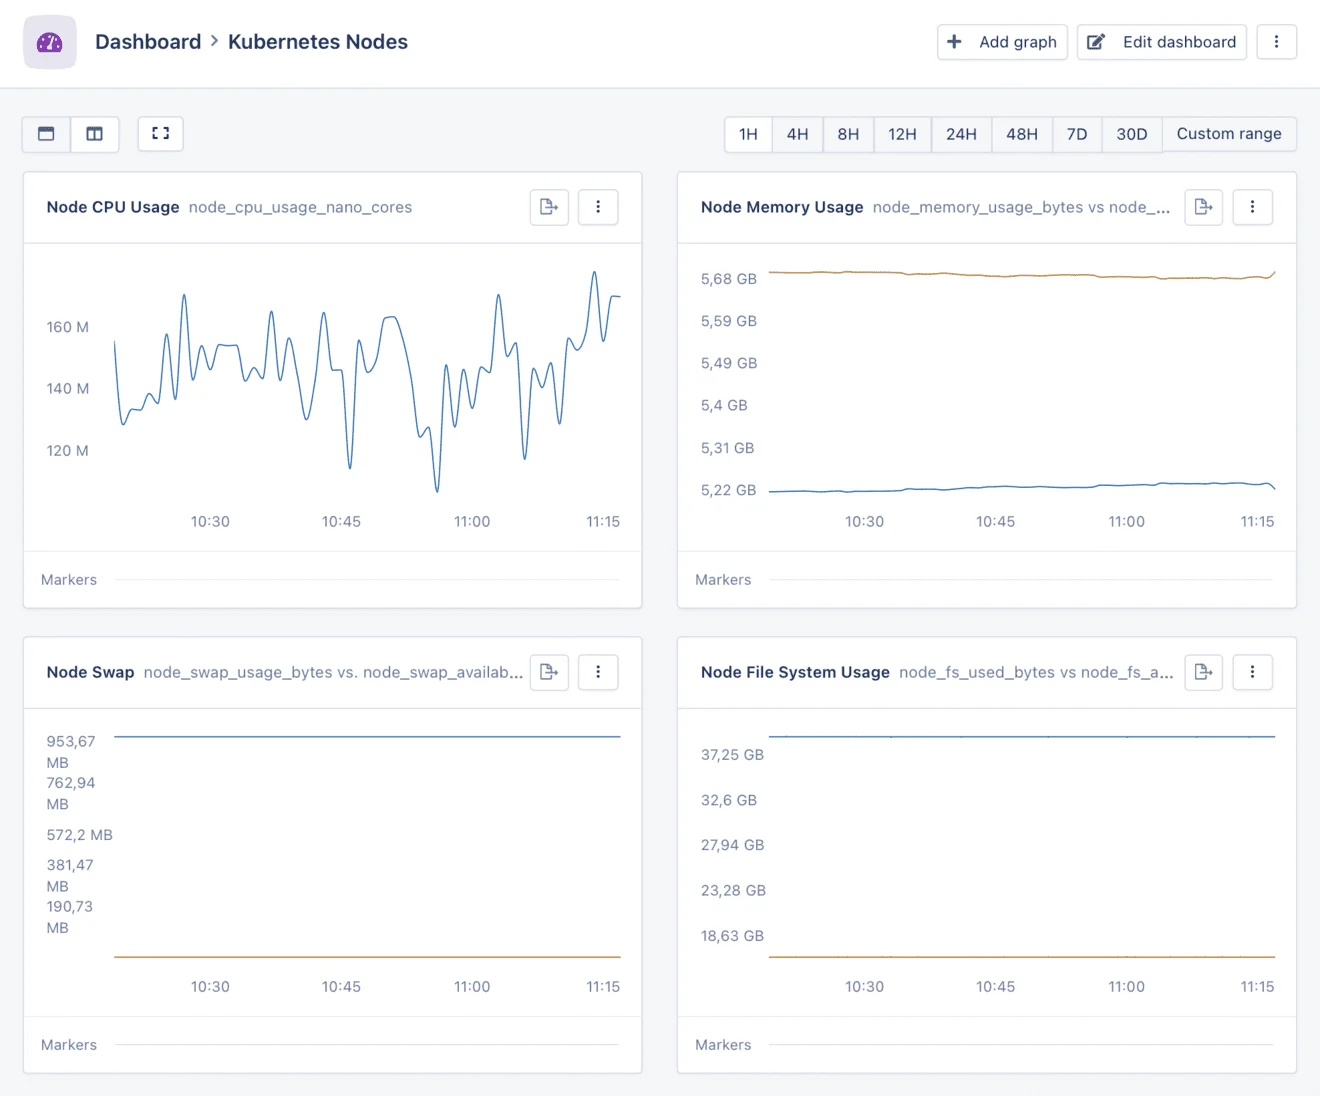
Your Kubernetes metrics will be used to create two magic dashboards. In both dashboards, you will be able to see graphs representing useful metrics over time, such as:- CPU Usage: CPU usage stats per node or pod
- Memory Usage: memory usage statistics, comparing the used memory to what’s available per node or pod
- Swap Usage: swap usage statistics, comparing the used swap to what’s available per node or pod
- Disk Usage: disk usage statistics, comparing the used disk space to what’s available per node
- Network usage: network usage, split by received and transmitted bytes per node
Metrics
AppSignal for Kubernetes extracts the following metrics from the/api/v1/nodes/<NODE>/proxy/stats/summary endpoint:
Node metrics
node_cpu_usage_nano_coresnode_cpu_usage_core_nano_secondsnode_memory_usage_bytesnode_memory_working_set_bytesnode_memory_rss_bytesnode_memory_page_faultsnode_memory_major_page_faultsnode_network_rx_bytesnode_network_rx_errorsnode_network_tx_bytesnode_network_tx_errorsnode_fs_available_bytesnode_s_capacity_bytesnode_fs_inodes_freenode_fs_inodesnode_fs_inodes_usednode_rlimit_maxpidnode_rlimit_curprocnode_swap_available_bytesnode_swap_usage_bytes
Pod metrics
pod_cpu_usage_nano_corespod_cpu_usage_core_nano_secondspod_memory_working_set_bytespod_swap_available_bytespod_swap_usage_bytes
Disabling host metrics
The Kubernetes dashboards serve as a replacement for AppSignal’s host metrics, and will eventually replace them altogether. In the meantime, we recommend disabling host metrics for Kubernetes setups by setting theenable_host_metrics configuration to false.