
Create a metric from a log line
The fastest way to create a metric is from a log line that already shows the data you want to track.- Open the Logs page for your app.
- Use the query bar to filter the log lines that match the event you want to measure.
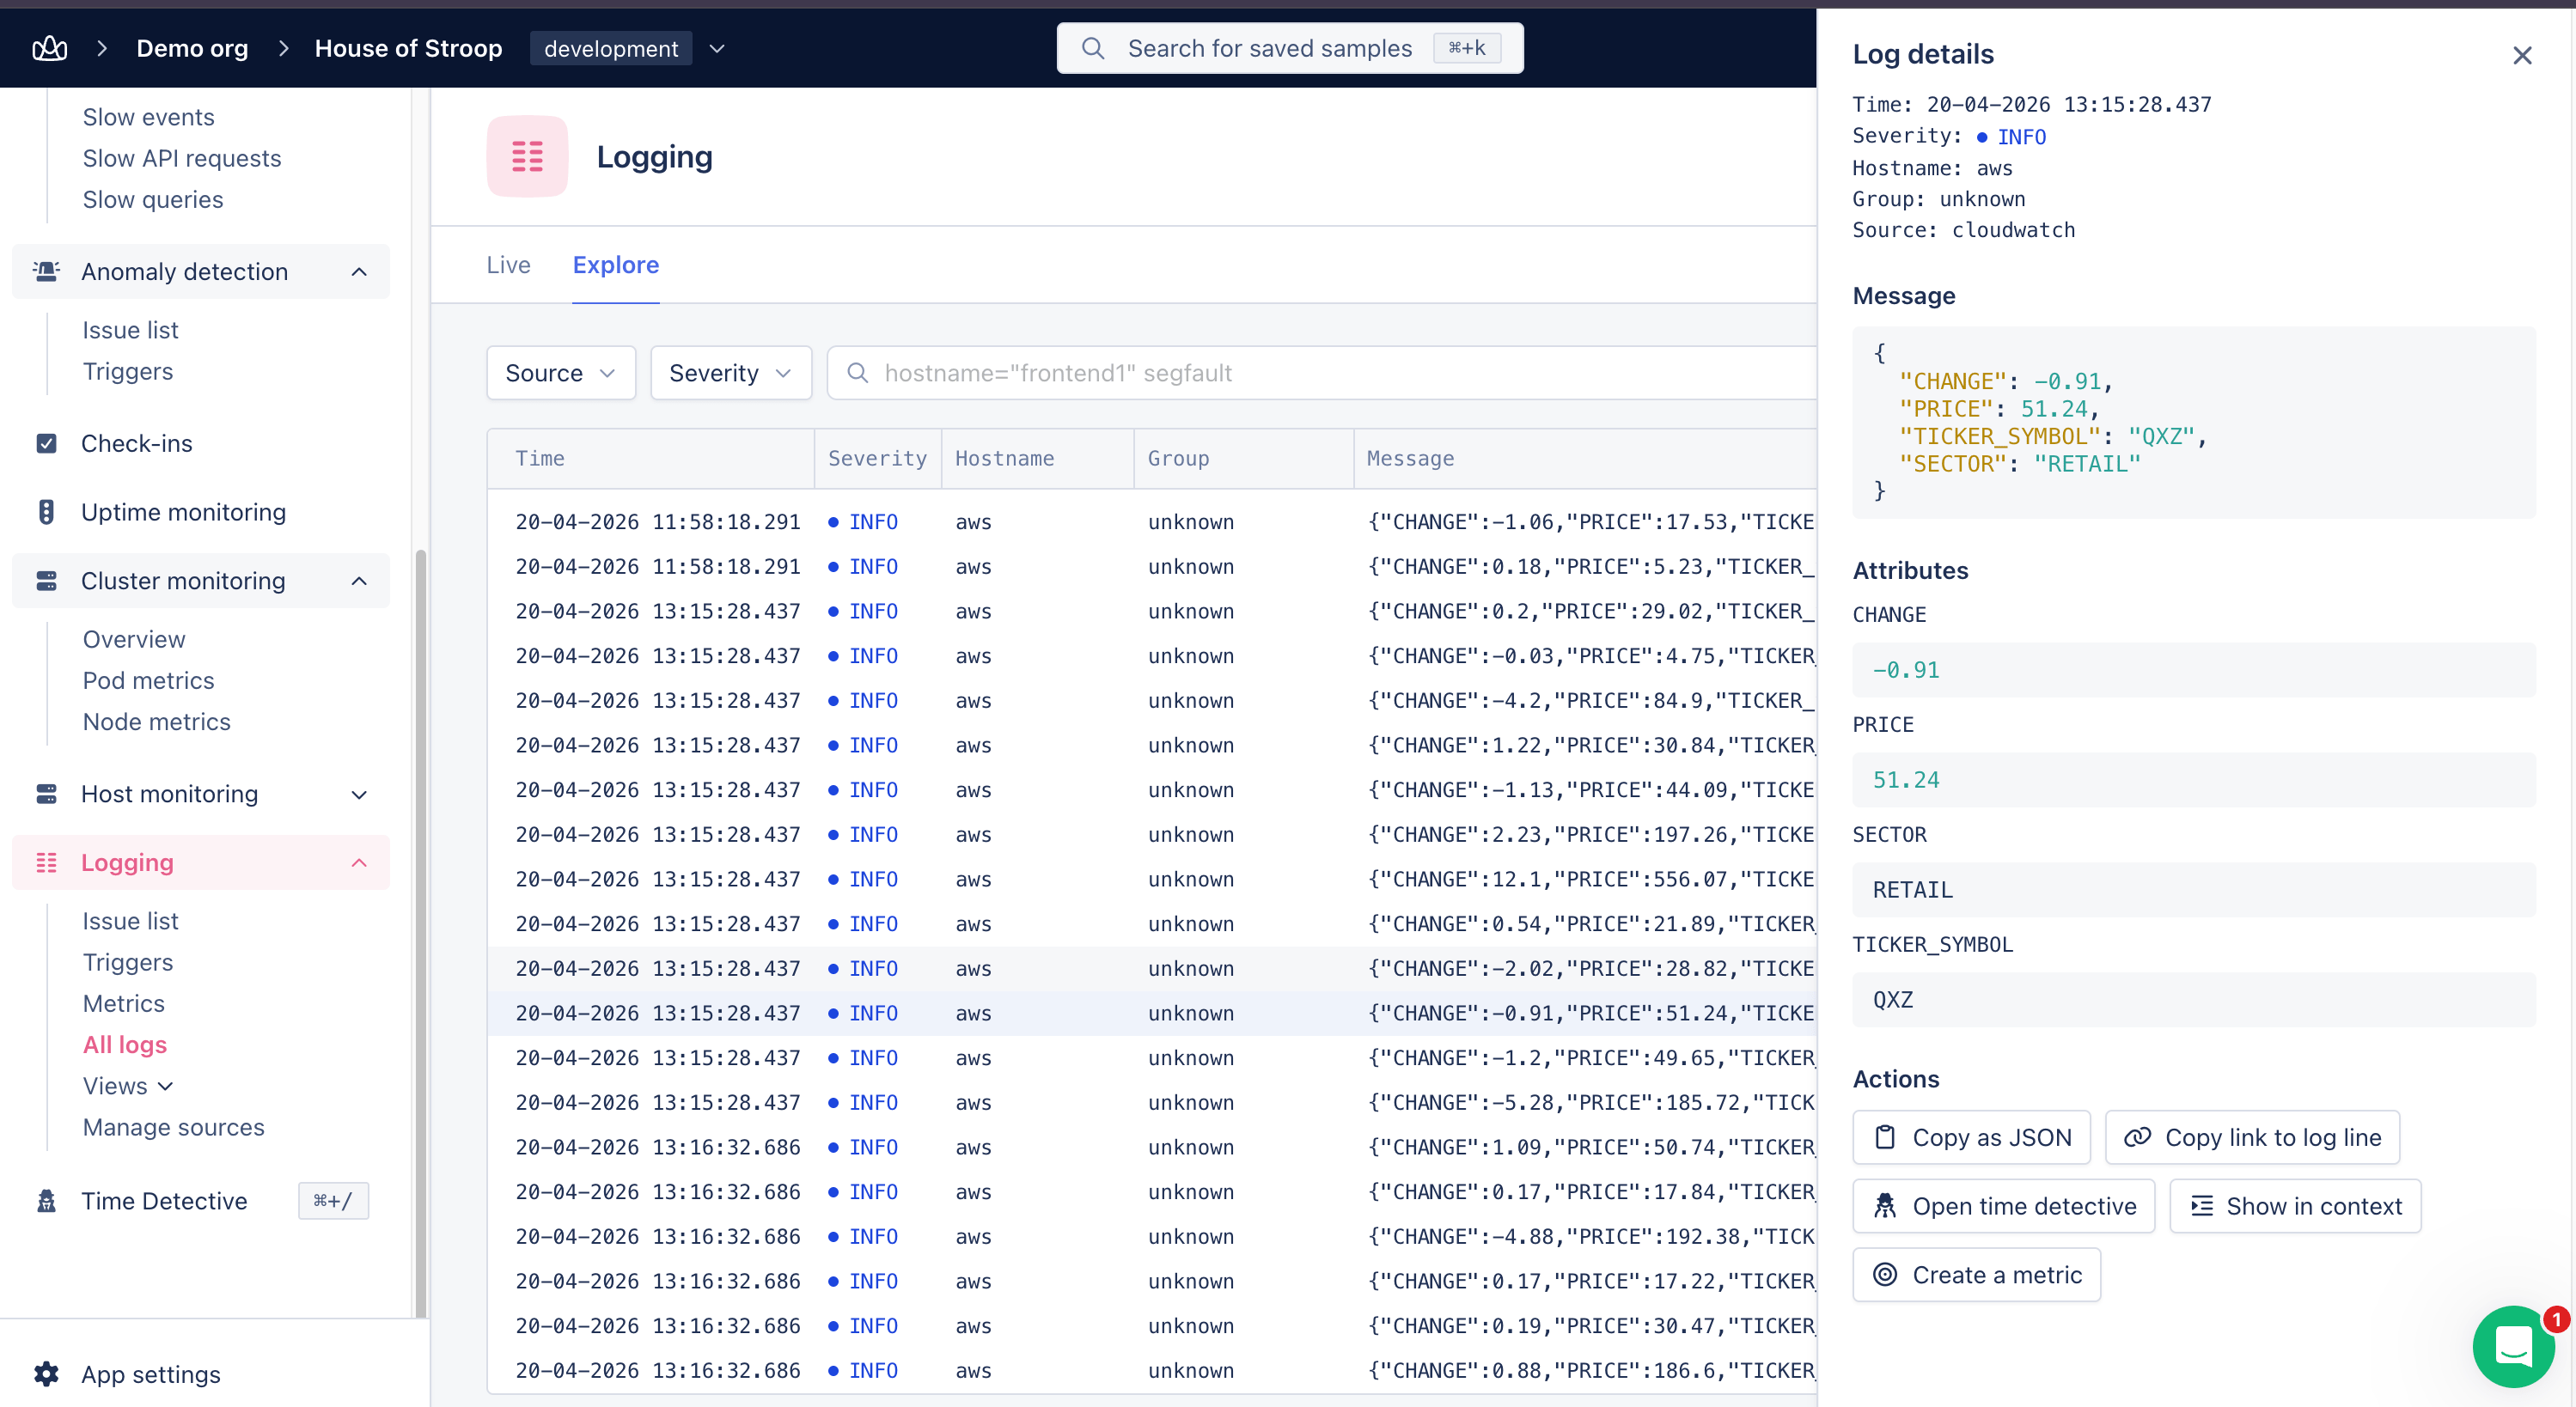
- Select a log line in the table to open the Log details panel.
- In the Actions section, select Create a metric.
- The Create metric overlay opens with the Log source, Severity, and Query fields prefilled from the log line.
Configure the metric
In the Define metric panel, fill in the fields that describe what you want to measure. As you change any field, the Data preview on the right updates so you can confirm the metric returns the data you expect.- Metric name: A unique name for the metric, used when you reference it on dashboards and triggers. See metric naming for the rules and recommendations.
- Log source: The log source the metric draws events from.
- Severity: Filter by severity, or select all to include every level.
- Query: The query string used to match log lines. Same syntax as the Logs page.
- Metric type: Count, Gauge, or Measurement. See metric types.
- Field to measure: For Gauge and Measurement metrics, the numeric field to track — like the duration or size of each event, instead of counting occurrences.
- Group by tag: Split the metric by a tag to get a separate series per unique value (for example, group by
hostnameto get one series per server).
Metric naming
We recommend naming your metrics something easily recognizable. Metric names only support numbers, letters, dots and underscores ([a-z0-9._]) as valid characters. Any other characters will be replaced with an underscore by our processor.
Some examples of good metric names are:
database_sizeaccount_countusers.countnotifier.failedorders.request.duration
Metric types
The metric type defines how AppSignal aggregates the data over time. The Field to measure field appears for Gauge and Measurement only, since Count just counts matching log lines.Count
The total number of matching events in a given time frame. Use this for events like errors, sign-ups, or job retries. Count does not require a Field to measure — it just counts every log line matching your query.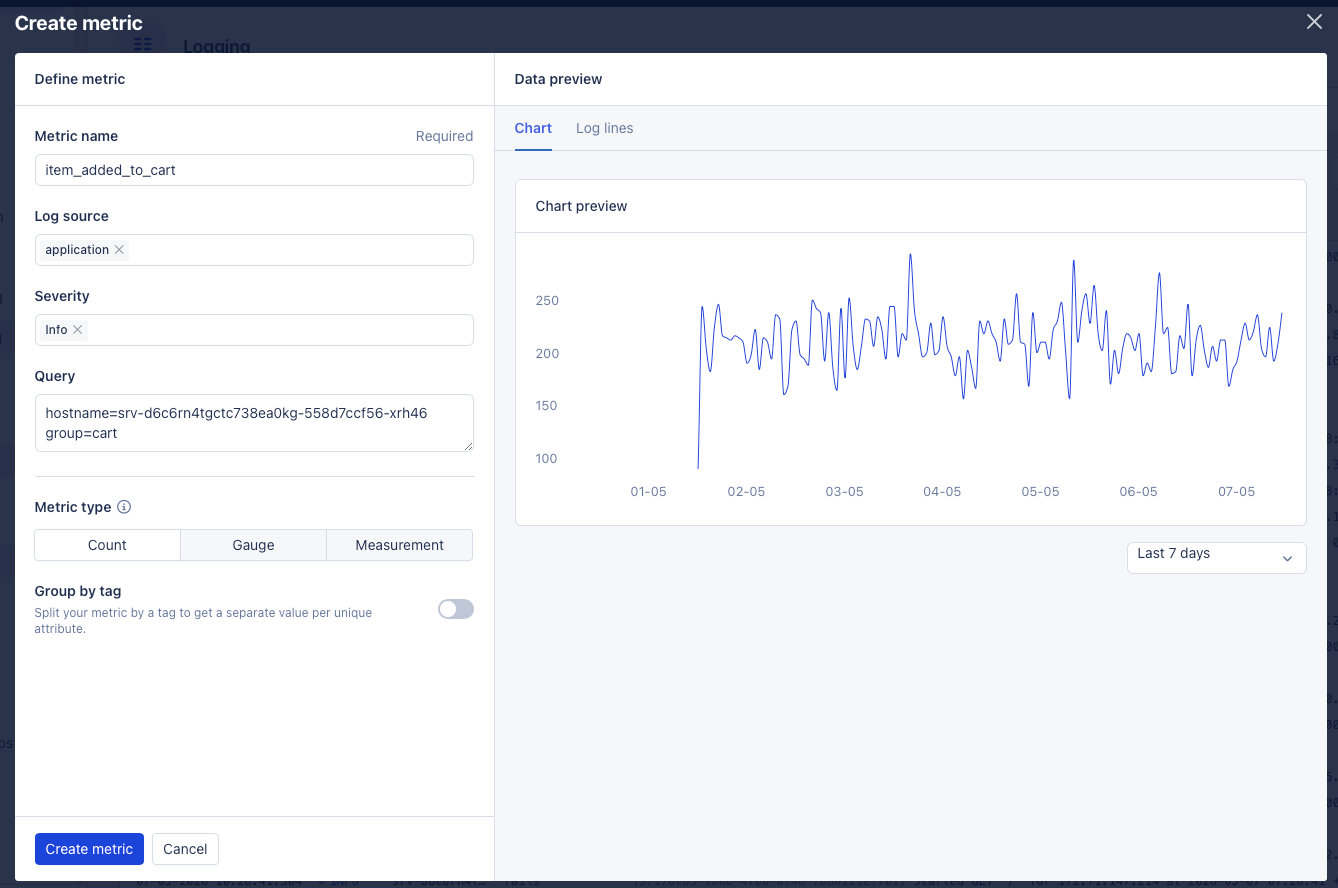
Gauge
The current value at the moment. Use this for values that move up and down, such as an active connection count.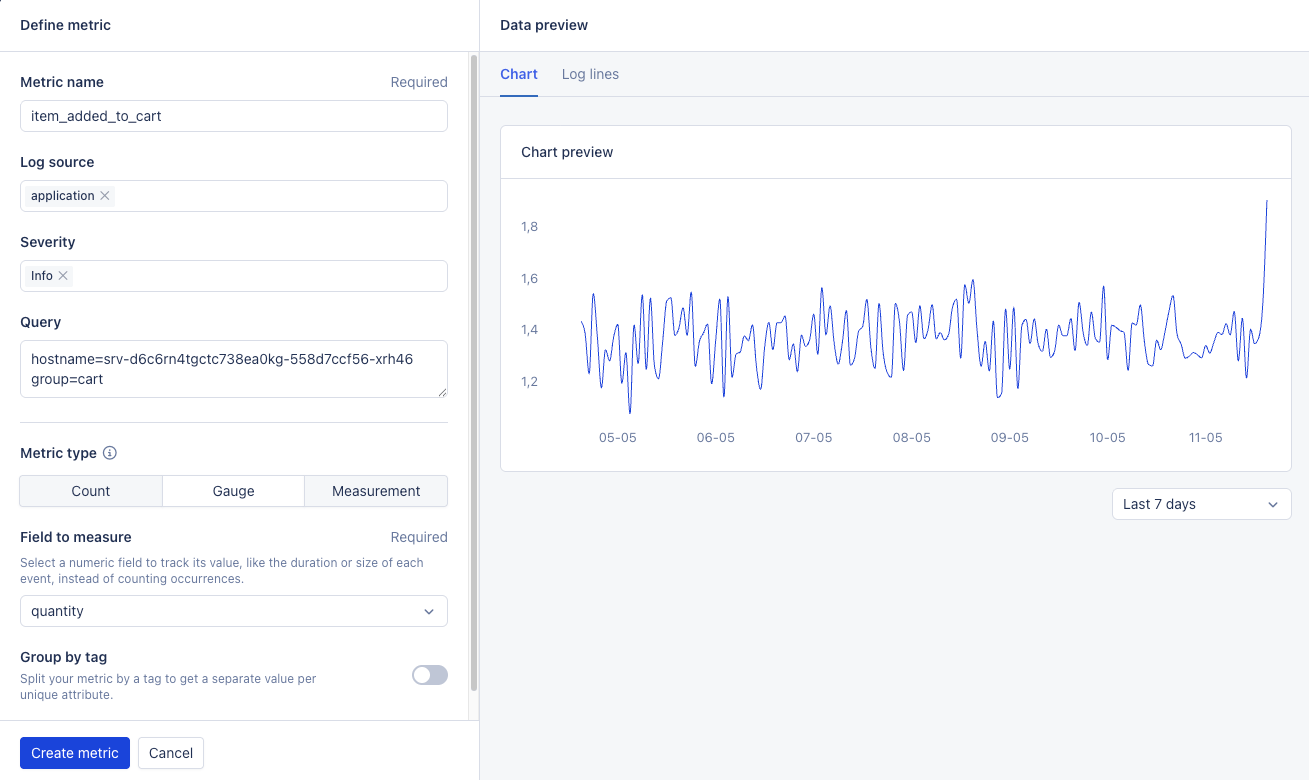
Measurement
Averages, counts, and percentiles for a numeric field over time. Use this when the distribution matters, such as request duration. Measurement persists the mean, count, and 90th/95th percentiles of the Field to measure for each interval.Preview your metric
The Data preview panel has two tabs that let you confirm the metric returns the data you expect before saving.Chart
A live chart of the metric for the selected time range. The chart preview supports selecting multiple log sources and severities, and updates as you change any field in the Define metric panel. Use the time-range selector below the chart to switch between Last 24 hours, Last 48 hours, and Last 7 days.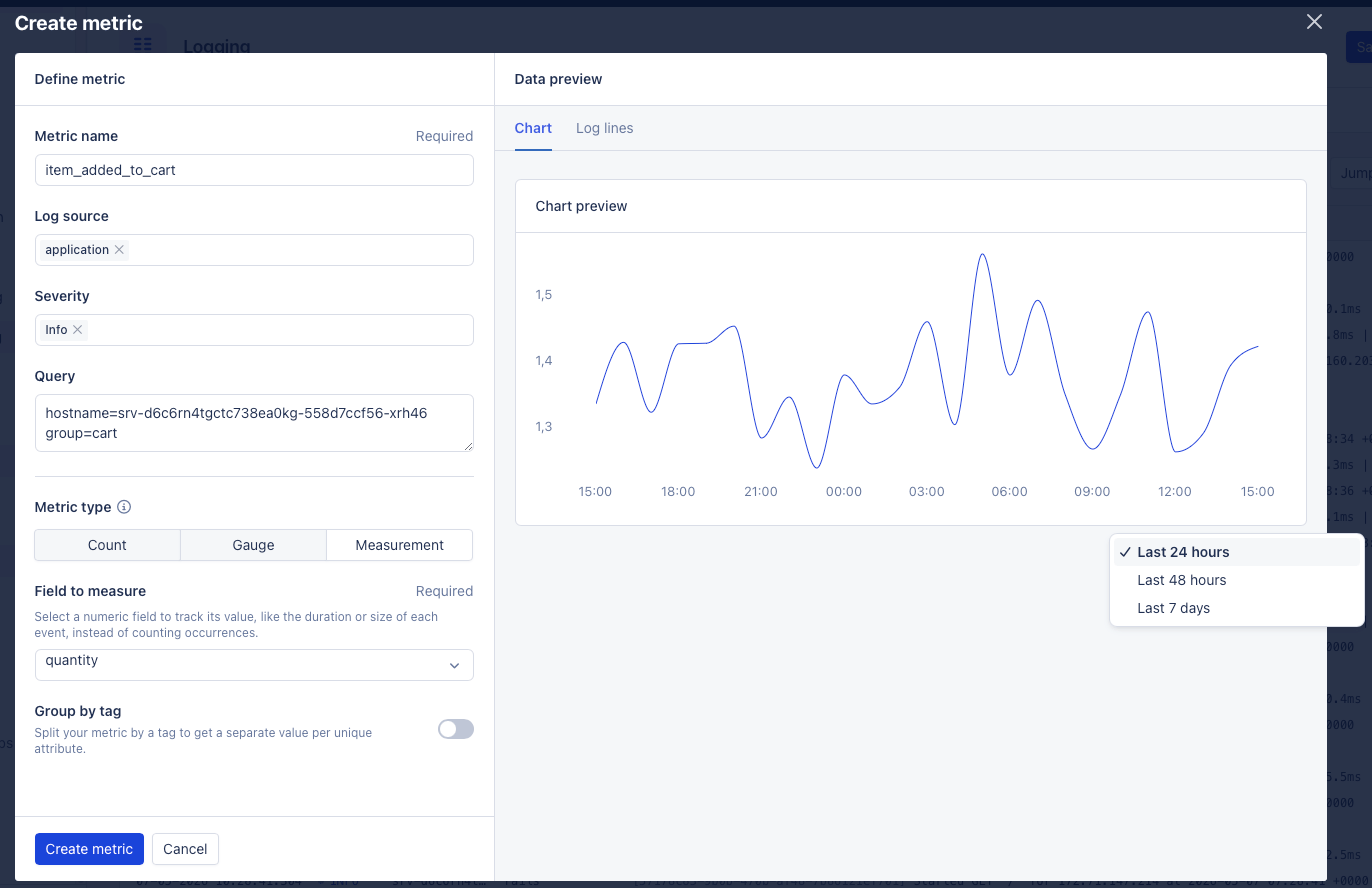
Log lines
The log lines that match your current query. When a Field to measure is set, that field is shown as a highlighted column so you can confirm the values before saving.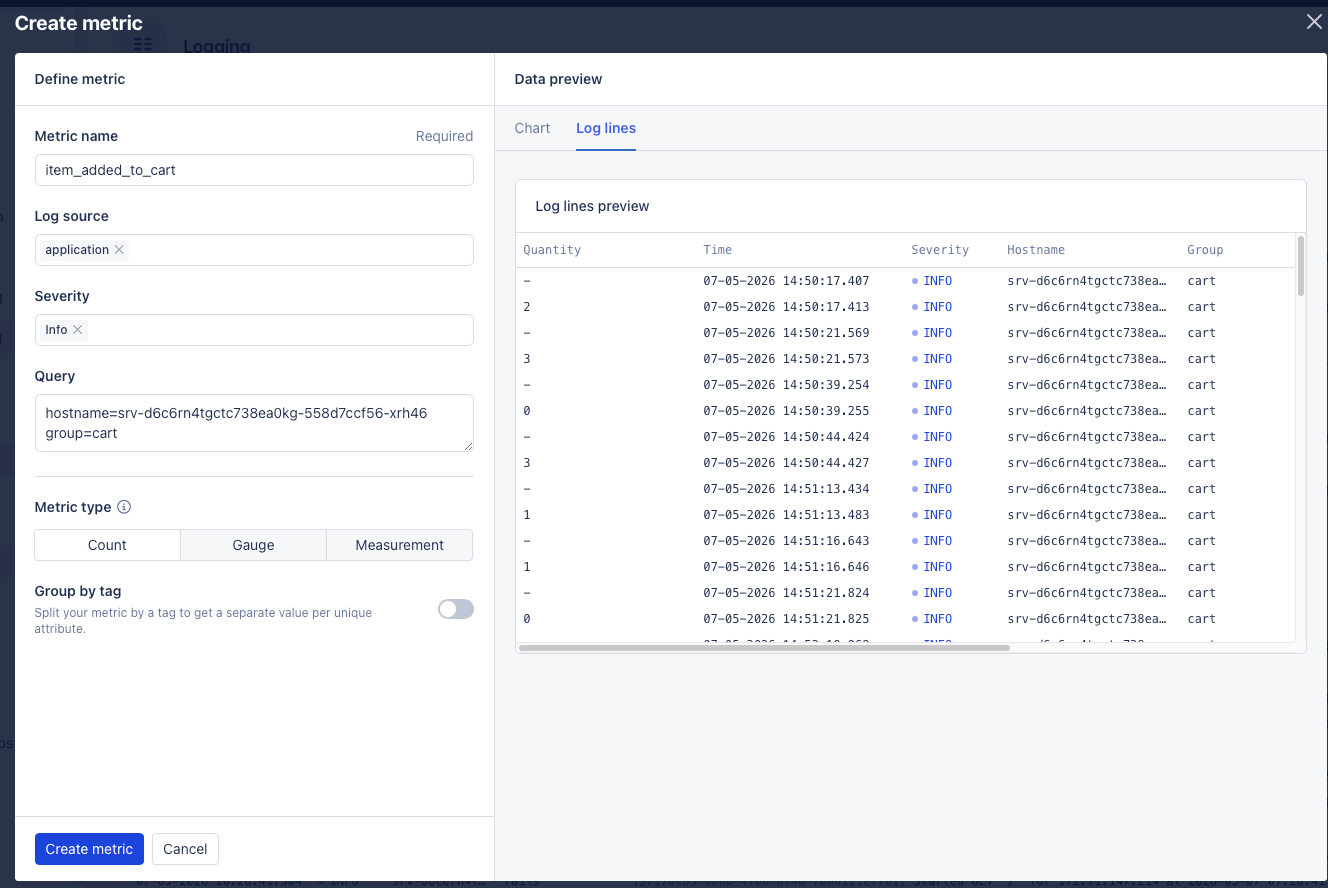
Choose what to do next
After you save a metric for the first time, AppSignal asks what you want to do with it:- Add to dashboard: Add the metric to a chart on an existing dashboard.
- Create a trigger: Open the trigger creation flow with the metric prefilled.
- Edit metric: Reopen the overlay to refine the configuration.
Edit a metric
- Open the Metrics page from the Logging side menu.
- Find the metric and select Edit from the three-dot menu.
- Adjust the Severity, Query, Field to measure, or Group by tag fields.
- Select Update metric to save.
Example: track request duration
- Metric name:
orders.request.duration - Log source: application
- Query:
path=/api/orders - Metric type: Measurement
- Field to measure:
duration_ms - Group by tag:
hostname
duration_ms for requests to /api/orders, with one series per host.