Alert states
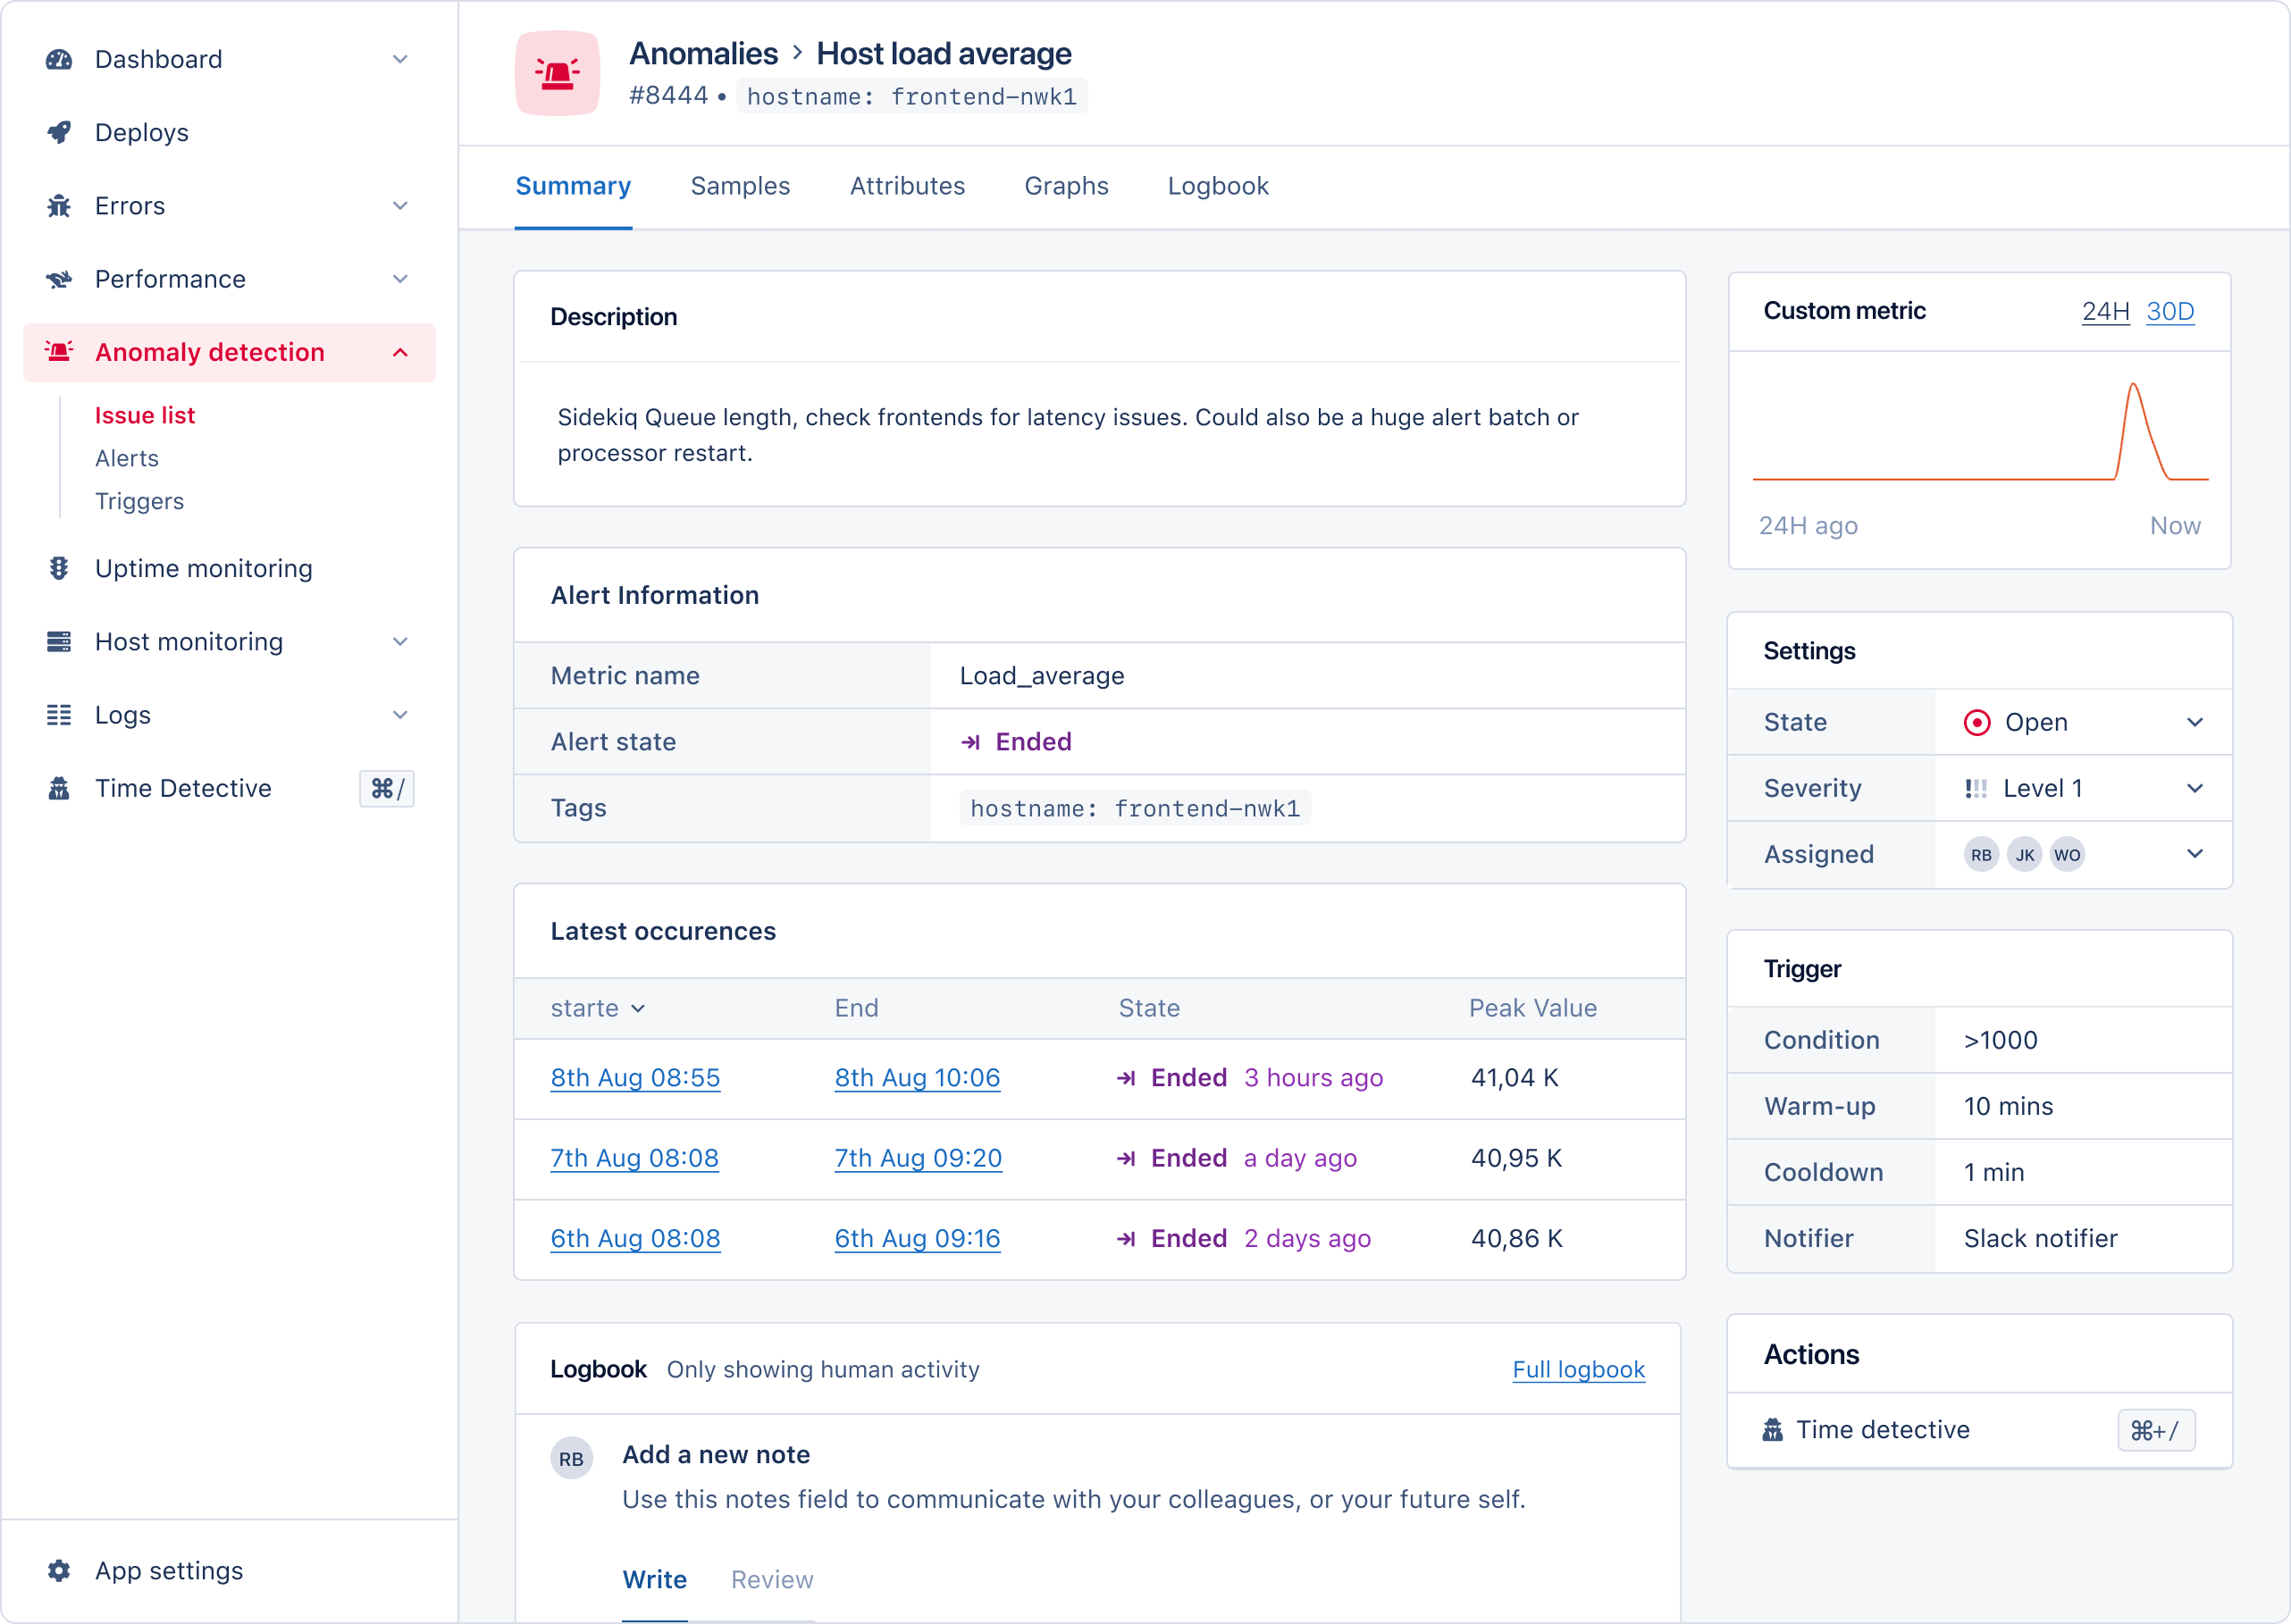
Alerts can have five states:
When will I be notified?
AppSignal notifies you on two state transitions: when an alert opens, and when it is resolved. Email can also send reminders while an alert stays open. Every other channel, including Slack, PagerDuty, Opsgenie, and webhooks, is notified only on the open and resolved transitions. Alerts are sent to the notifiers selected on the trigger, not to every notifier configured on the app.Silencing a trigger
Unlike error incidents, alerts have no notification frequency options. There is no Never Notify or Every Nth per Hour setting, because notifications follow the alert state machine rather than a count of occurrences. To stop a trigger from notifying anyone, remove its notifiers. To stop it from producing alerts at all, archive it. Trigger alert routing is controlled on the trigger itself. Select the notifiers that should receive alerts from that trigger, or remove all notifiers to keep the trigger active without sending notifications.Email alerts
Alert emails will include an overview of new alerts, reminders, and the status of other alerts that have yet to end.Creating and configuring triggers
Configure anomaly detection per app from the “Anomaly detection” section in the app navigation. The alert overview shows the latest alerts created by triggers configured for the app. Open the triggers page to create and edit triggers. Select Add trigger to open the metric picker, then choose a trigger type from Tracing, Host metrics, or Other. Custom metric triggers are listed under Other as Custom metrics.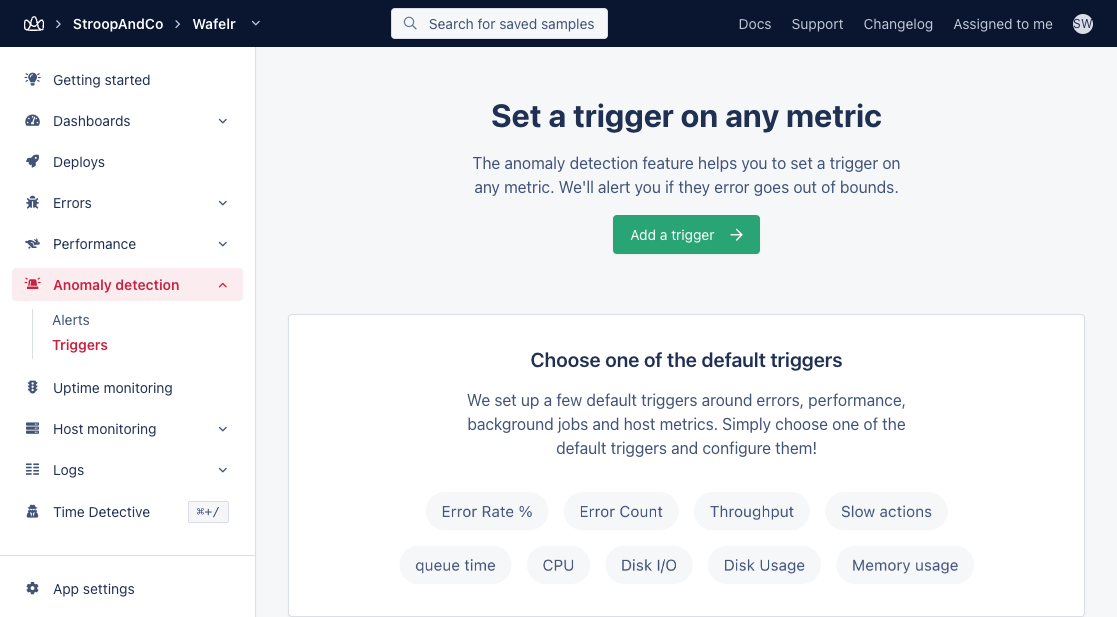
- Error rates
- Error (absolute) counts
- App throughput
- Performance of actions (slow actions)
- Queue time
- Host metrics
- CPU load
- Disk I/O
- Disk usage
- Load averages
- Memory usage
- Network usage
Warm-up and cooldown
You can configure warm-up and cooldown settings for each trigger. These settings define how long AppSignal waits before opening and closing an alert.Warm-up
Typically, when a trigger’s threshold condition is reached, it opens an alert. For example, the error rate is higher than 5%. When a trigger has a warm-up period, AppSignal opens the alert only after the threshold condition has stayed true for the whole warm-up period. For example, the error rate must stay higher than 5% for more than 3 minutes. AppSignal will notify you when the alert status shifts from warm-up to open.Cooldown
Alerts opened by a trigger are automatically closed when the threshold condition is no longer met. To avoid repeated open and close notifications for the same issue, configure a cooldown period. If you configure a cooldown period, AppSignal will not create a new alert unless the trigger condition is met again after the cooldown period expires. For example:- An alert opens because the error rate is higher than 5%.
- The error rate drops, so the alert closes.
- The trigger has a two-minute cooldown period.
- The error rate goes above 5% again.
- AppSignal does not create a new alert unless the error rate exceeds 5% after the cooldown period ends.
Tags
Some metrics require tags to be selected as well. For example, if you are sending a custom metric to AppSignal that has tags: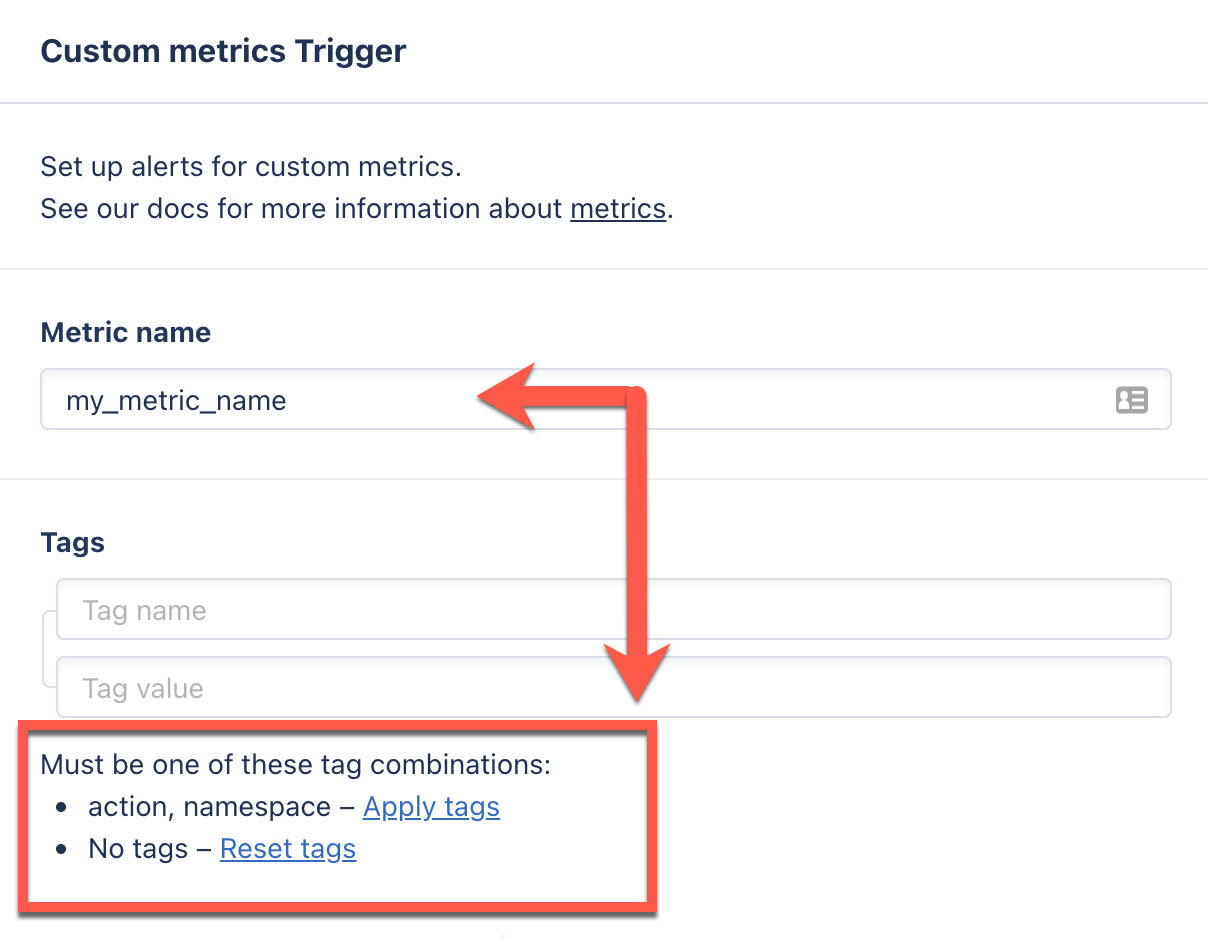
namespace or namespace, queue. Tag values can be exact values like namespace=web or wildcards like queue=*.
One trigger can open several alerts
A trigger opens one alert per matching series, not one alert in total. A trigger that matches 30 hosts opens 30 alerts when all 30 cross the threshold. Host metric triggers make this easy to overlook, because the hostname field supports wildcards and its default value of* matches every host reporting to the app. Enter a specific hostname, or a prefix such as web-*, to limit which hosts a trigger covers.
The same applies to tags on any other metric. The narrower the tag filter, the more specific the alert, and the fewer notifications a single incident produces.
Editing and archiving triggers
Changing or archiving a trigger can affect the alerts and incidents attached to it. Editing or archiving a trigger can have these effects:- Alerts still in their warm-up phase are discarded.
- Open alerts are closed and marked as archived.
- When you edit a trigger, open anomaly incidents for the previous trigger are linked to the new trigger so the incident history and logbook stay available across the edit.
- When you archive a trigger without replacing it, open anomaly incidents for that trigger are closed.
Missing datapoints as 0
By default, triggers assume that a data point is sent every minute. This may not be feasible in situations such as incrementing a counter only when a specific action occurs. In these cases, enable Treat missing datapoints as 0. AppSignal then treats a missing data point as zero, which helps an alert close when no data arrives in the next minute. It also makes absence alerts possible, such as alerting when a metric reaches0.
Data processing
The metrics used by triggers to create alerts are not instantly processed when the metrics are sent from your application to AppSignal. Your metrics data will go through multiple systems before it arrives at our processor. The data may also be sent from multiple servers that send data at different intervals. The processor then waits* until all the data for a minute has arrived before processing that data and creating or updating alerts. If you experience problems with the metrics AppSignal reports for anomaly detection, ensure that your application’s servers report simultaneously by configuring them using NTP. Incorrect or different reported times from multiple app servers can prevent alerts from opening or closing. You can learn more about how AppSignal processes data for Anomaly detection and what this means for the alerts in our data life cycle documentation. *: For more information on wait time specifics, consult our data life cycle page.Managing incidents
You can view all alert incidents on the Anomaly Issues page in the AppSignal app. The Issues page displays an overview of all open alert incidents, ordered by their last occurrence, with columns for the anomaly:- Name
- Status
- Assignees
- State
- Last state change time
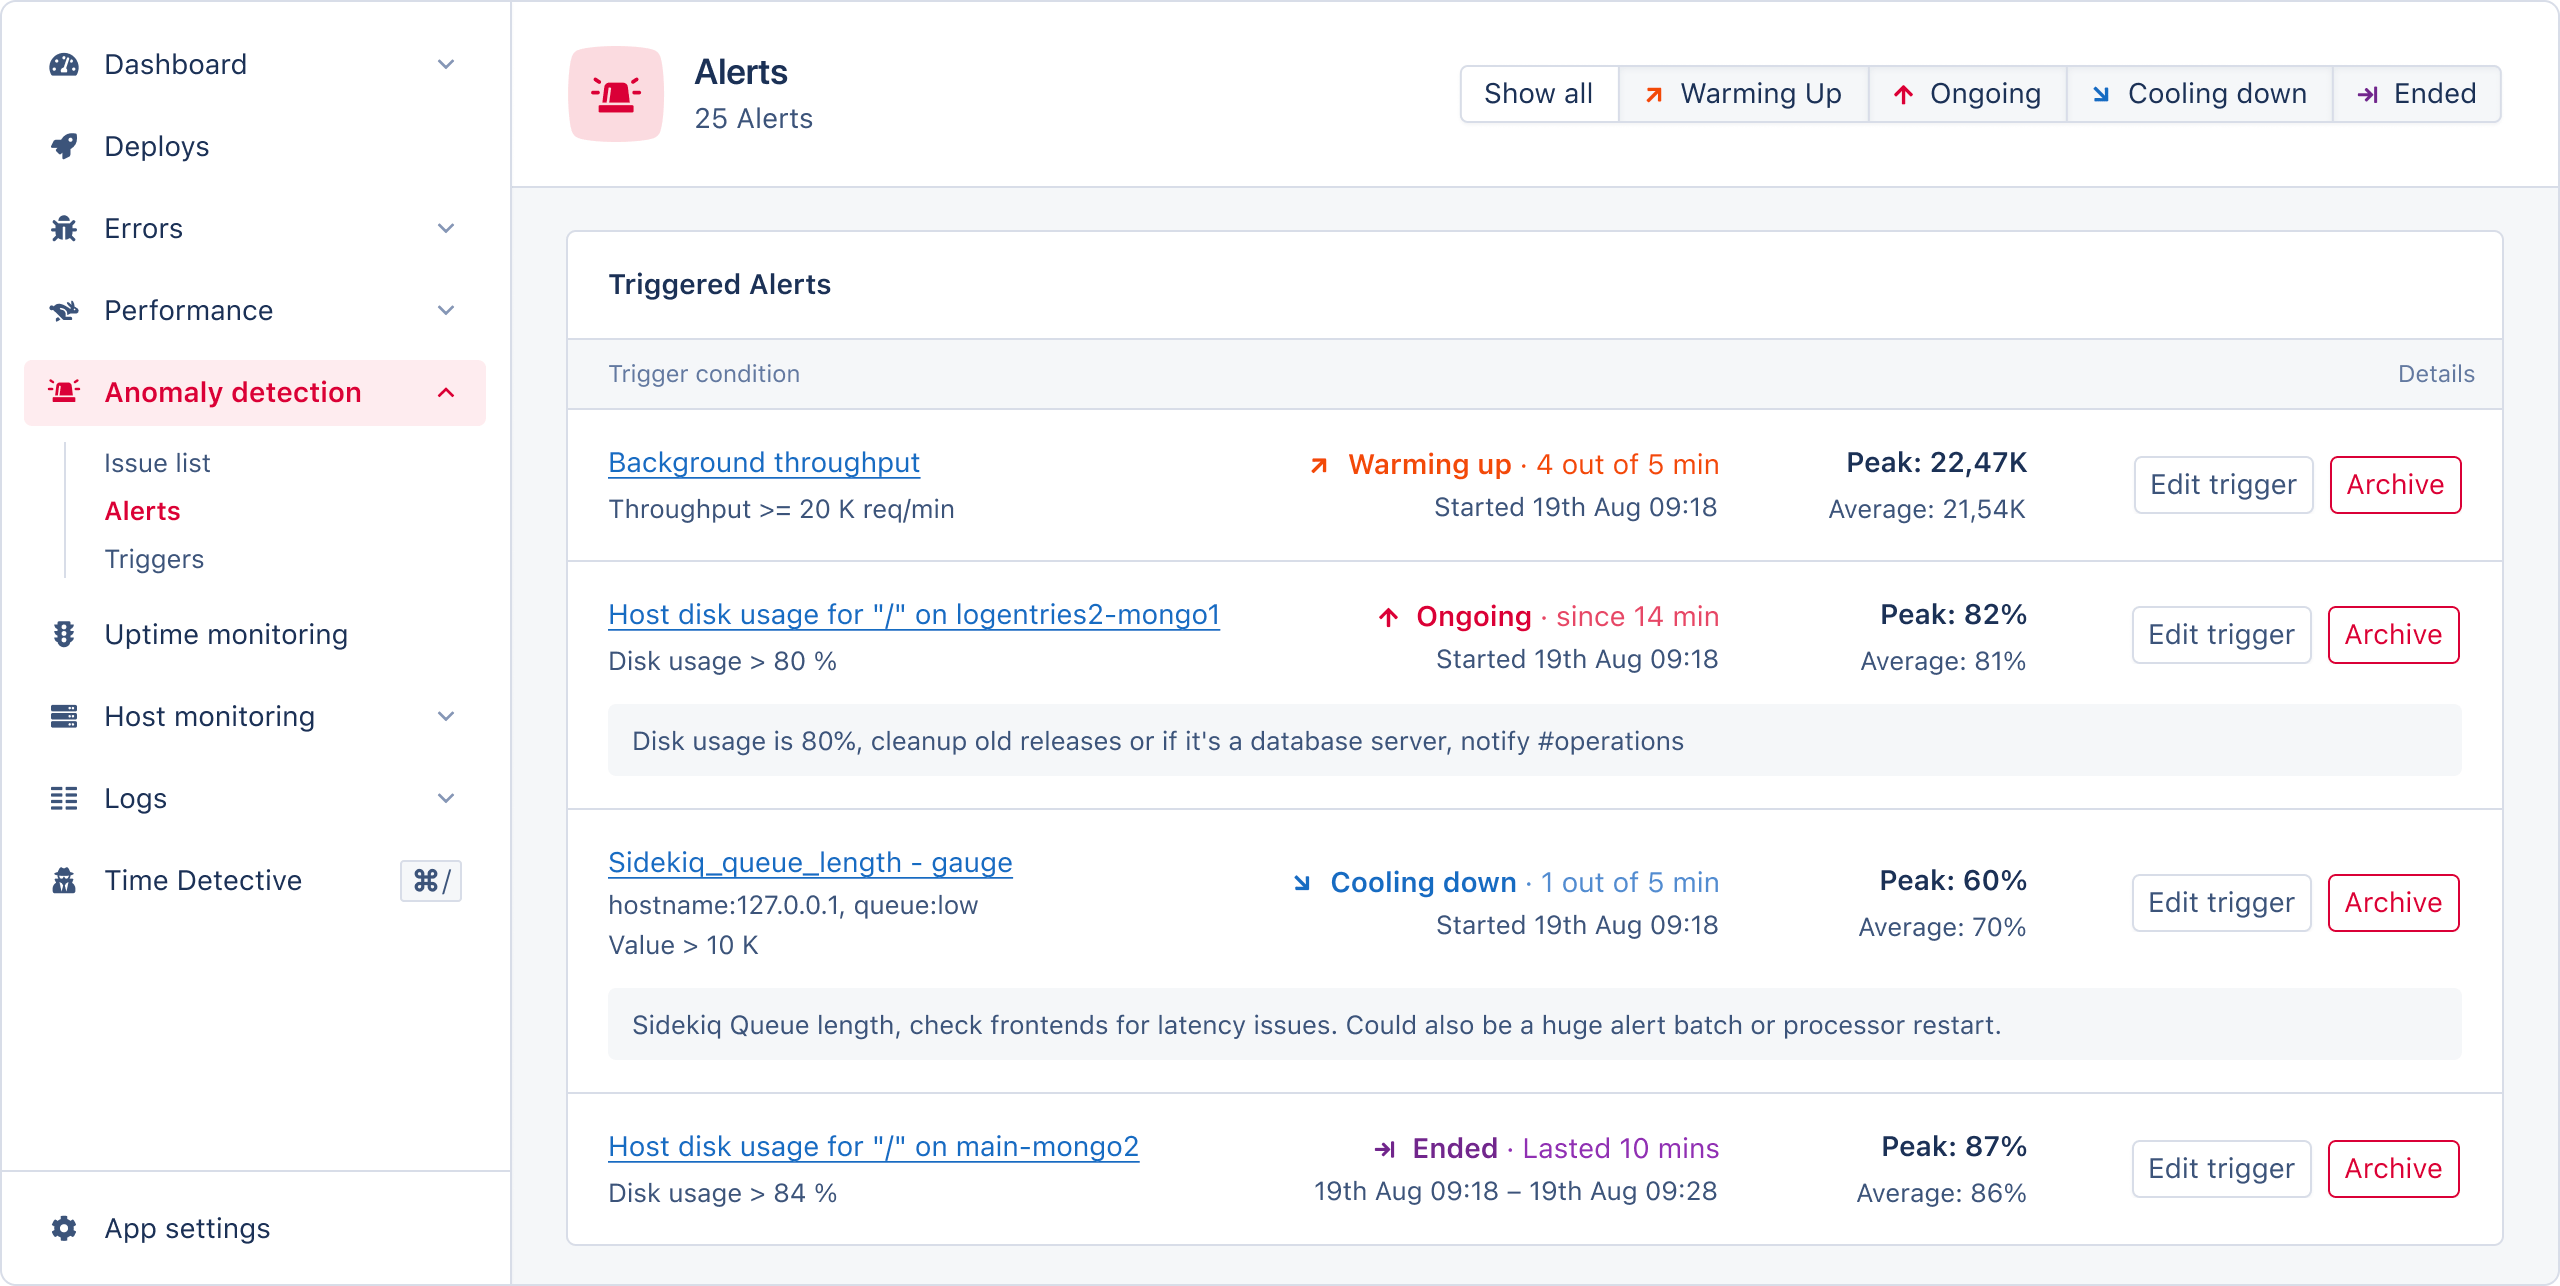
- Alert information: The metric name, alert state, and tags of the alert.
- Occurrence frequency graph: A visual representation of the alert’s occurrence.
- Incident Settings: Ability to close the alert, set its severity, and assign it to a team member.
- Trigger Information: The conditions required to trigger the alert.
- Latest occurrences: A table of the most recent occurrences, with their start/end time, state, and peak value.
- Logbook: A logbook for logging important alert information about this alert for your team or future self.
- Access to the Time Detective: Use the Time Detective tool to view the state of your application when the alert last occurred.