Puma metrics plugin
The AppSignal Puma plugin will collect metrics about how Puma is operating. When AppSignal detects Puma metrics, it will create an Intelligence dashboard, allowing you to monitor core metrics visually. To enable the metrics collection, add the AppSignal plugin to your Puma configuration:Usage with prune_bundler
If your puma.rb file includes prune_bundler, you must add AppSignal as a runtime dependency.
Usage with preload_app!
If your puma.rb file includes preload_app!, some configuration is required to correctly report metrics from minutely probes. When preload_app! is true, the minutely probes are run in the Puma primary process. In the primary process, the probes cannot access the same data that the app running in Puma workers can, reporting inaccurate or no data.
In the Puma puma.rb config file, stop the AppSignal minutely probes in the before_fork callback to stop the minutely probes in the Puma main process. Then, start the minutely probes in the worker process from the on_worker_boot callback.
Secrets
If you use a library such as Rails or dotenv to manage your app’s secrets and configure AppSignal, you will need to load these in your Puma configuration. AppSignal runs a background process in Puma’s main process when using the Puma plugin. The rest of your app is not loaded by default in Puma’s main process (unless you usepreload_app!, which may not be suitable for your app). Without additional configuration, the AppSignal config will fail to load, and AppSignal will not start.
No “on boot” hook is available in Puma to load your extra config in the main process. To load your configuration, add it to the root of your puma.rb configuration file, as in the example below.
Hostname
This probe listens to theAPPSIGNAL_HOSTNAME config option from the environment
variable for the hostname tag
added to all its metrics. If none is set, it will try to detect it automatically.
Use the APPSIGNAL_HOSTNAME system environment variable to set the hostname if you
want to change the detected hostname.
StatsD port
This probe listens to theAPPSIGNAL_STATSD_PORT config option from the environment variable for the configuration of non-default StatsD ports. If the environment variable is not set, it defaults to 8125. For the Puma main process, it is required to use the environment variable; it will not read the AppSignal file configuration.
Phased restart
Puma phased restarts don’t restart the main Puma process, meaning that the AppSignal background process does not get restarted either on a phased restart. If you have made changes to the AppSignal config, you will need to fully restart your Puma app afterward to have the configuration change take effect.Intelligence dashboard
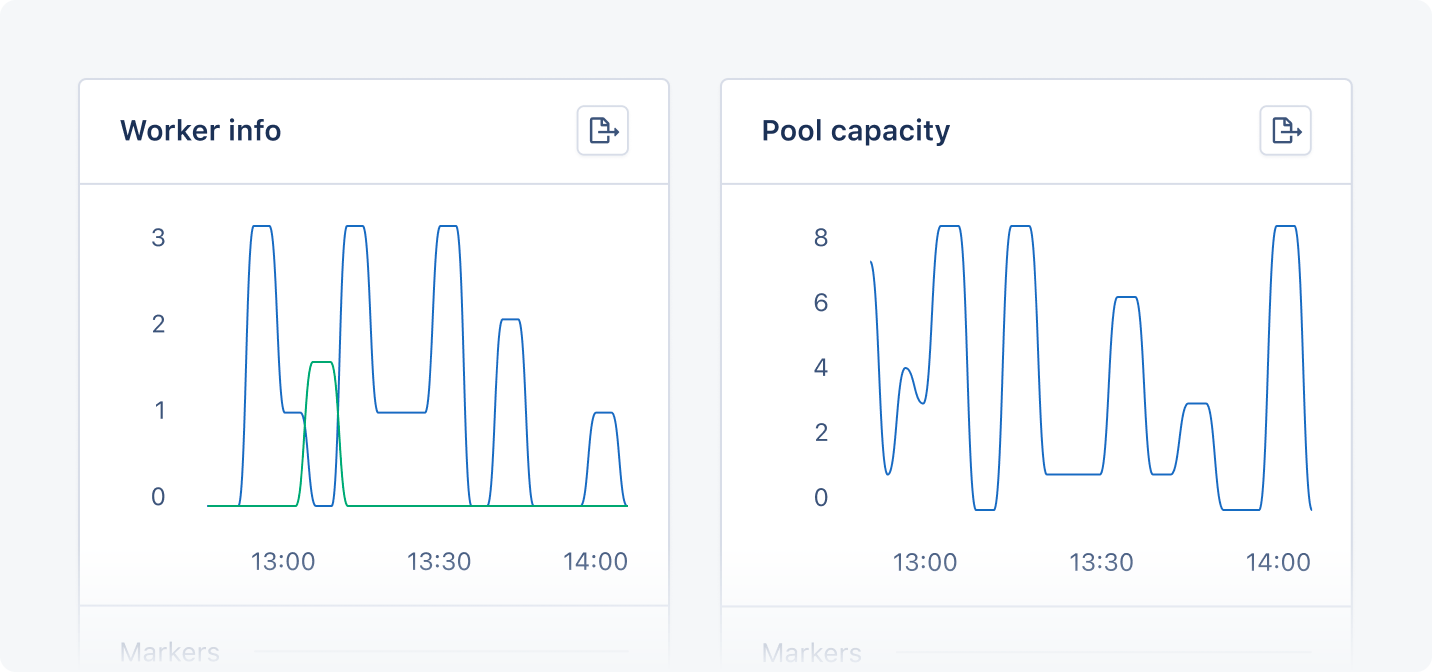
When AppSignal receives Puma metrics, it will create a Puma Intelligence dashboard, available from the dashboard section of the AppSignal app. The Puma Intelligence dashboard will have the following graphs:
Tags give you a contextual breakdown of Active job performance information. AppSignal reports the following tags for Active Job jobs:
Graphs allow you to monitor your application’s metrics visually. You can add markers to graphs and click on any data point to gain insights into your application’s state at that time.