instrument_mongo config option to false.
Performance monitoring
Once AppSignal begins reporting MongoDB metrics, AppSignal will give you performance insights via:Event timeline
The event timeline gives you deep insights into MongoDB query performance, allowing you to see exactly what queries are run, when, and what impact they’re having on your application’s responsiveness.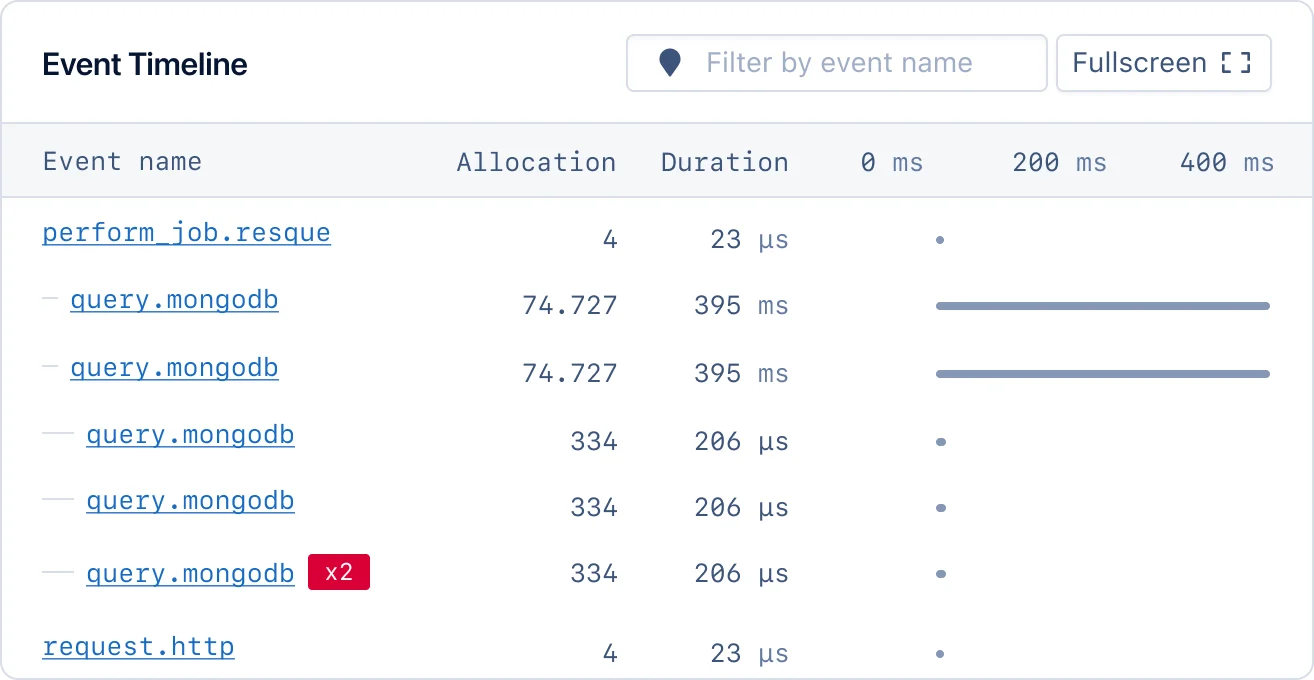
Sample breakdown
Sample breakdowns allow you to review MongoDB performance at a glance, allowing you to quickly spot performance problems without having to dive deep into the details.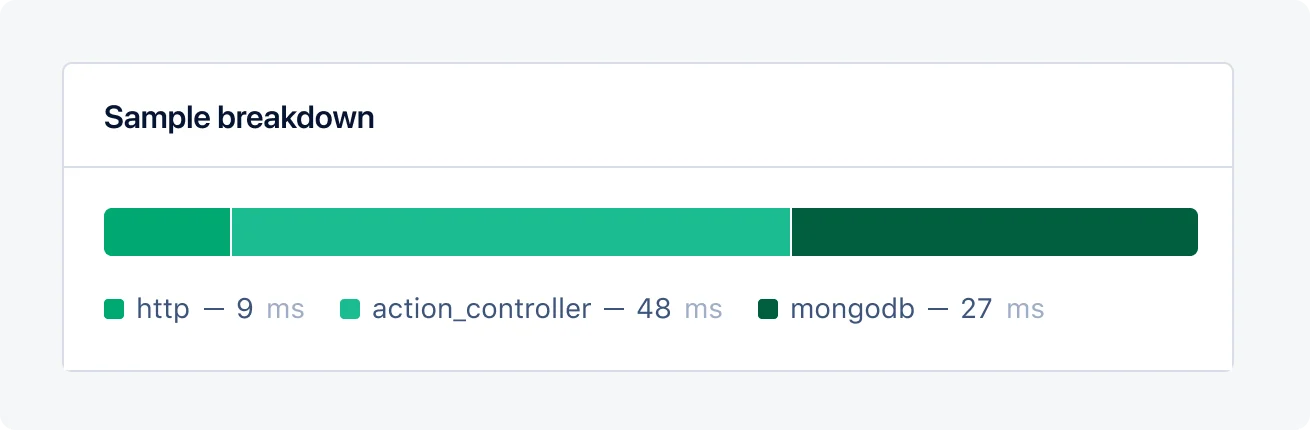
Slow queries
AppSignal has a whole suite of tools aimed at helping you improve your application’s performance. Slow queries is a simple and informative overview of your application’s slow queries and the impact they’re having on your application’s performance, allowing you to quickly and confidently decide on the steps needed to optimize them.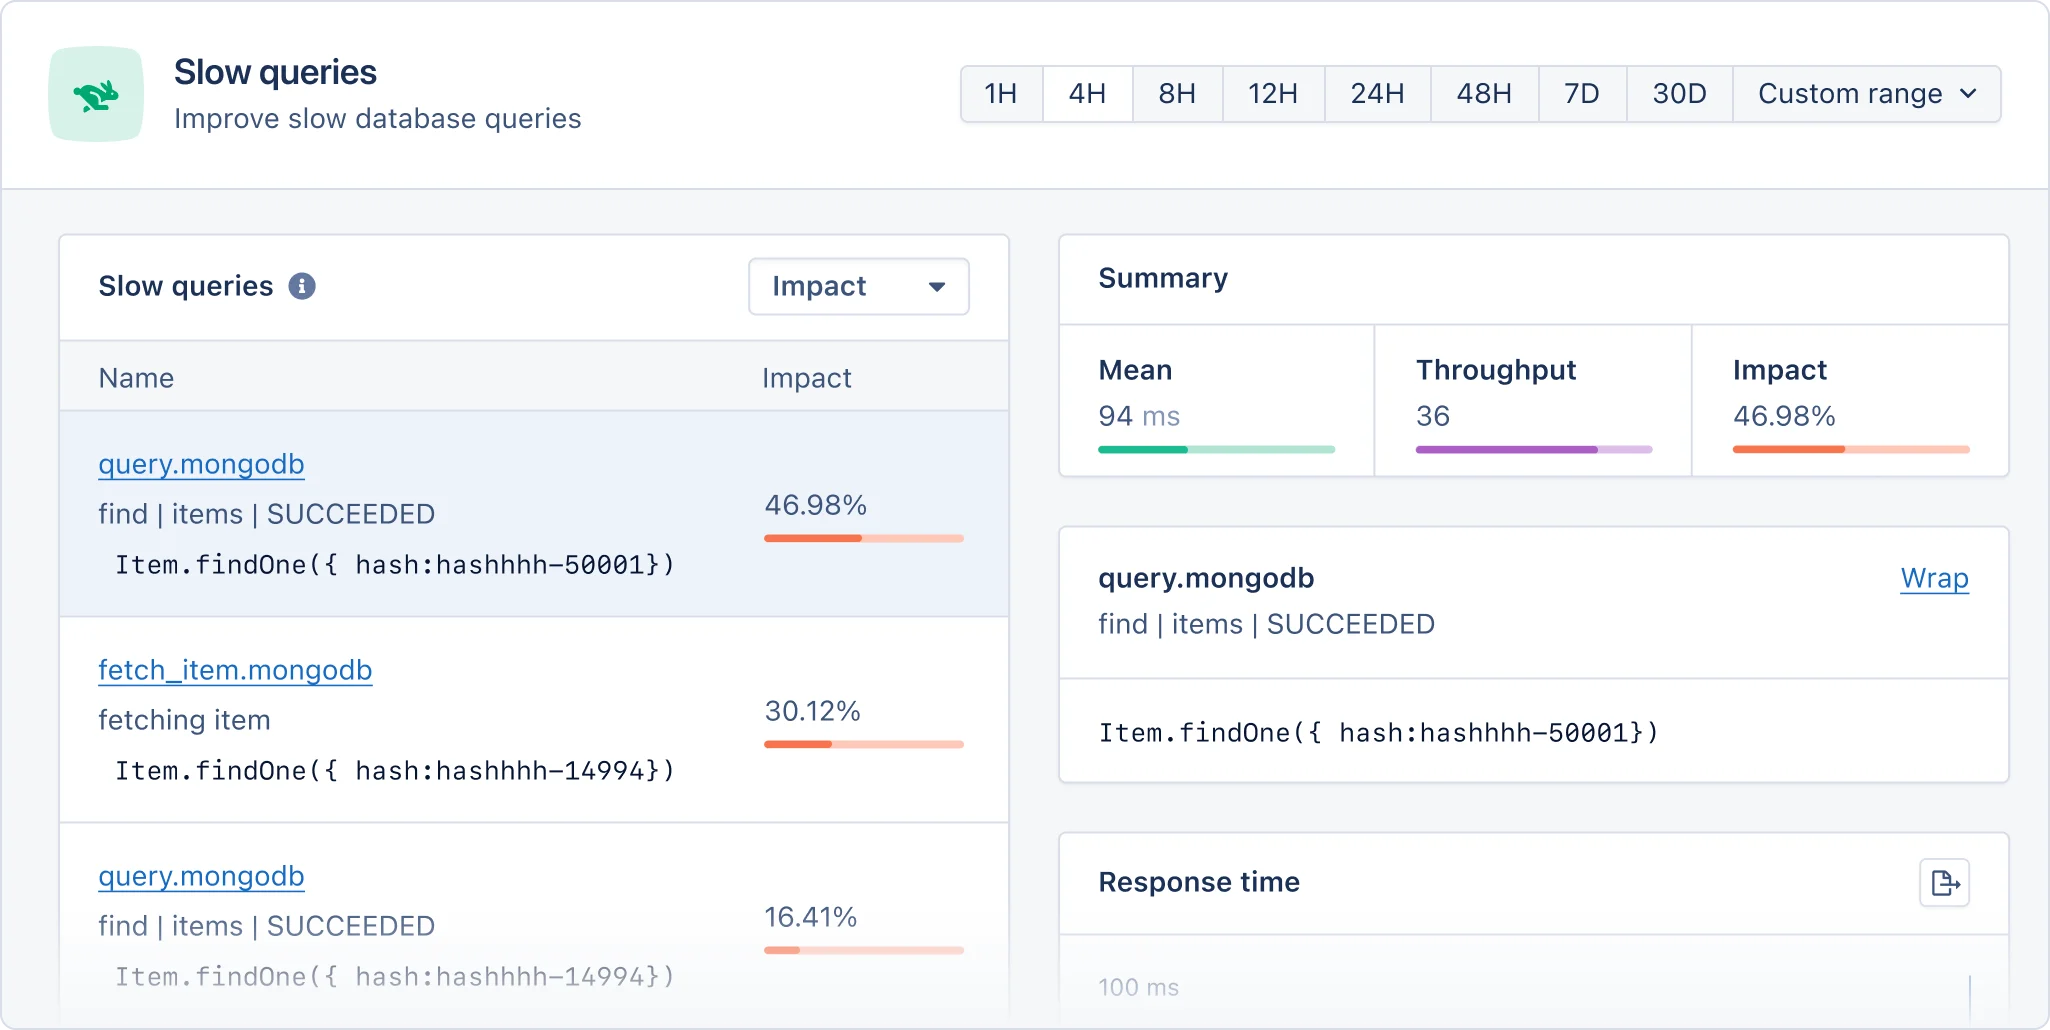
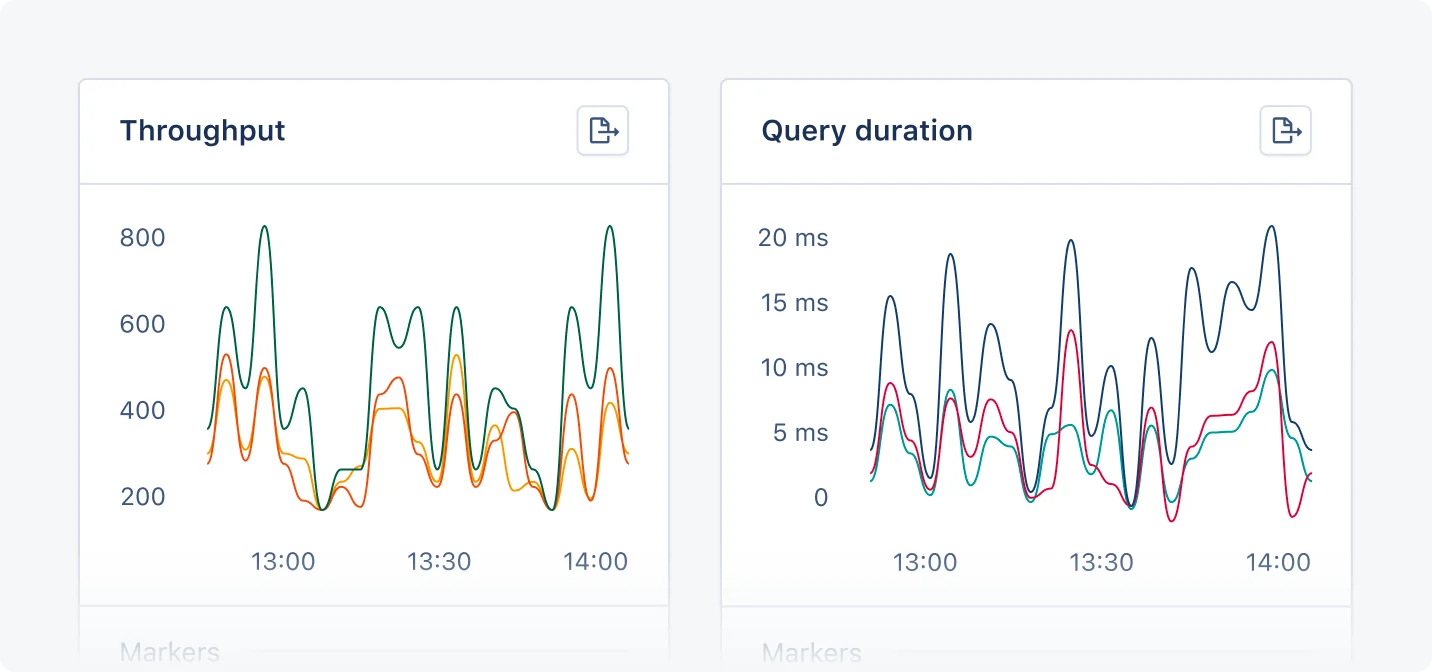
Intelligence dashboard
When AppSignal receives MongoDB metrics, it will create a MongoDB Intelligence dashboard, available from the dashboard section of the AppSignal app. The MongoDB Intelligence dashboard will have the following graphs:
Tags give you a contextual breakdown of MongoDB performance information. AppSignal reports the following tag for MongoDB metrics:
Each tag will be represented with a colored line on the graph: