Supported adapters
The Active Job integration supports all Active Job adapters. It may also offer support for adapters not listed on that page, which are accessible through a separate gem. However, these adapters have not been tested.Integration with AppSignal-supported libraries
The following background job libraries that AppSignal supports are automatically integrated with Active Job, allowing AppSignal to give you more in-depth performance insights:Report errors on job discard
Set theactivejob_report_errors config option to discard to only report errors when a job is discarded. When a job is discarded, all job retries have been exhausted, and the job is no longer retried. Read the Active Job documentation to learn more about Active Job exception handling and failed job retries.
Enqueue instrumentation
Enqueuing a job through Active Job records anenqueue.active_job event, titled after the job being enqueued. When a job is enqueued through an adapter that AppSignal also instruments, such as Sidekiq or Resque, AppSignal suppresses the adapter’s own enqueue event and records the enqueue once as the Active Job event.
AppSignal records enqueue events on the active transaction’s event timeline, for example when you enqueue a job from within a web request or from within another job. It only records them when a transaction is active, so enqueuing a job outside of a transaction records nothing.
To stop recording enqueue events across all background job integrations, set the enable_job_enqueue_instrumentation config option to false. This does not affect the instrumentation of the jobs themselves.
Metadata
AppSignal collects the following metadata for Active Job jobs:
*From Rails version 6 onwards queue times are reported for the namespace they are reported from and can be viewed in AppSignal’s Performance Graphs.
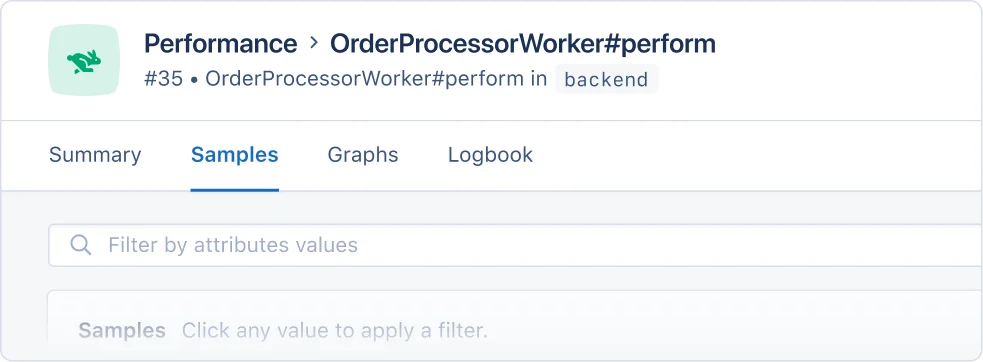
AppSignal uses Active Job metadata to give you deeper contextual insights into job performance. When inspecting Active Job samples in AppSignal:
- The Job name will be used to group the job for AppSignal incidents:
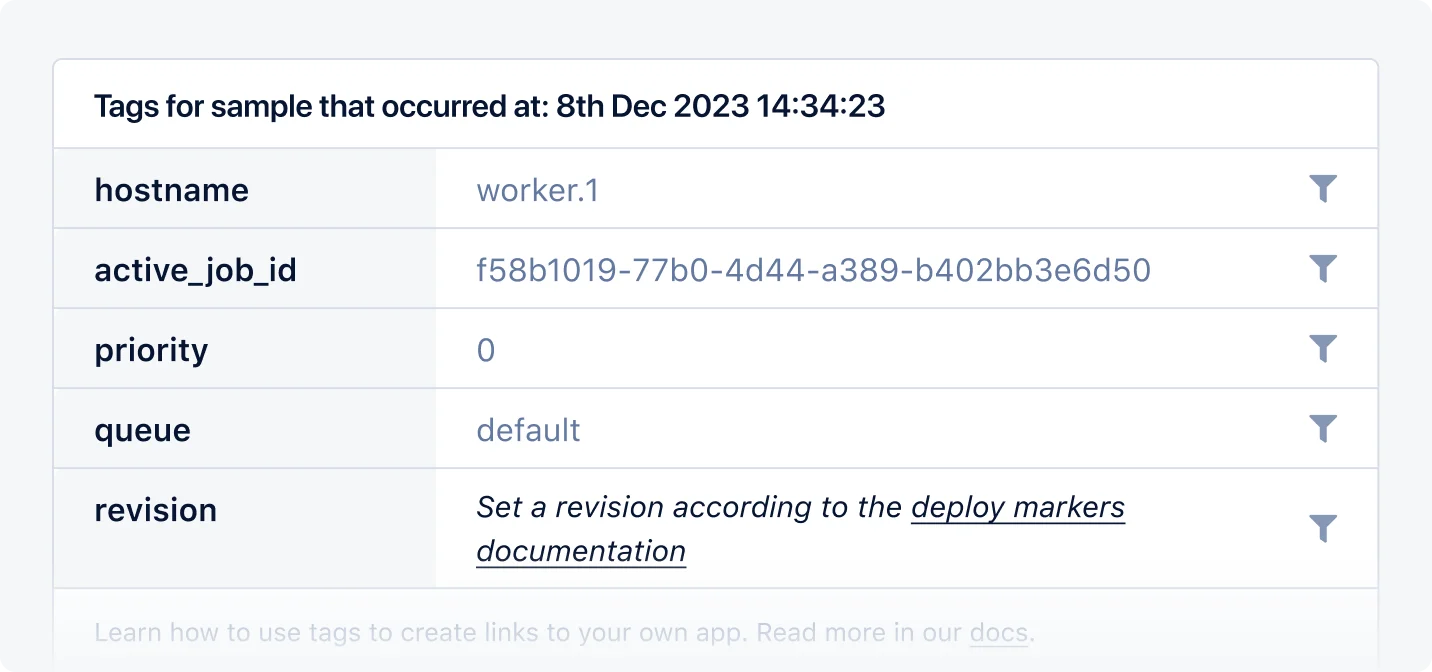
- Metadata (excluding job name and events) will be available as filterable tags on incident samples:
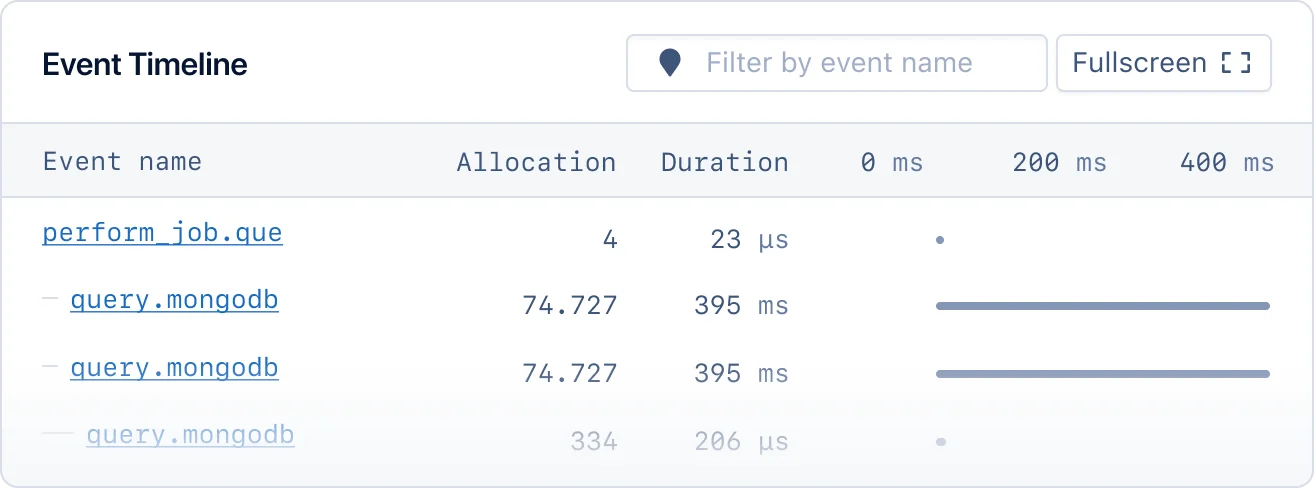
*.active_jobevents will be shown in the event timeline for performance samples:
Magic dashboard
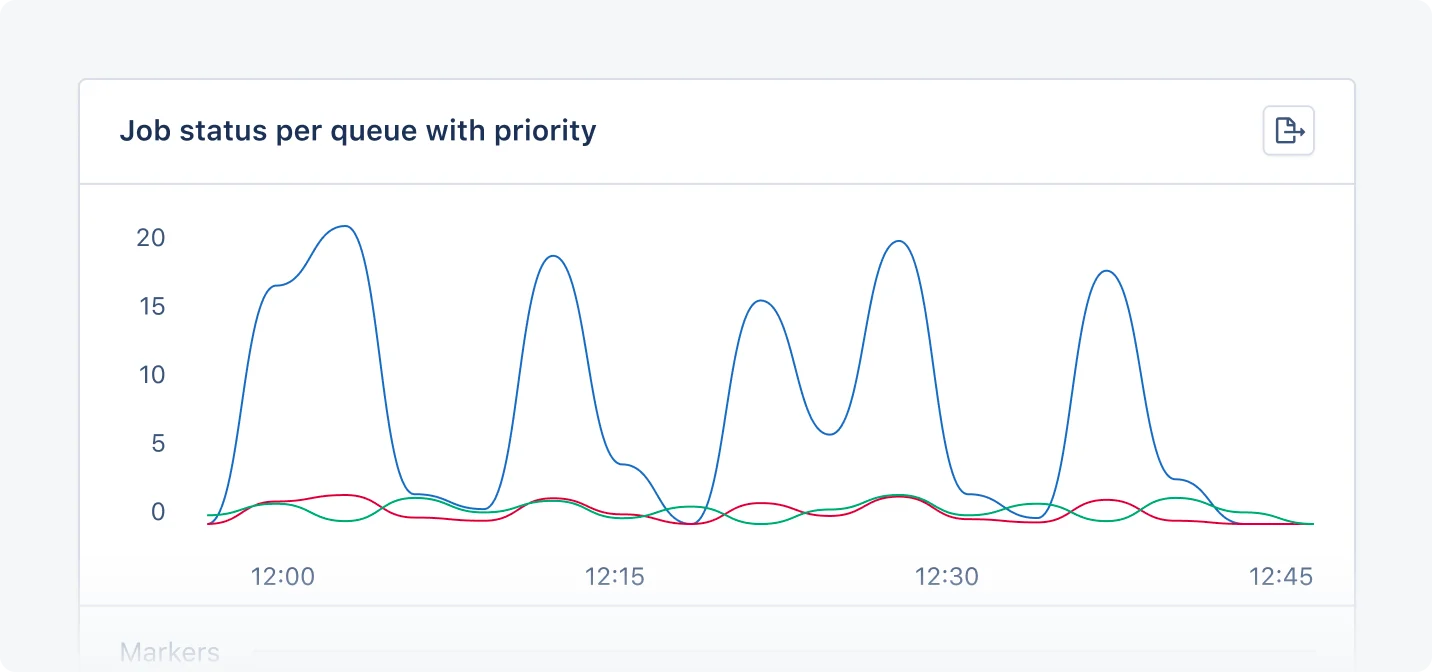
When AppSignal receives Active Job metrics, it will create an Active Job magic dashboard, available from the dashboard section of the AppSignal app. The Active Job magic dashboard will have the following graphs:
Tags give you a contextual breakdown of Active Job performance information. AppSignal reports the following tags for Active Job jobs:
Each tag will be represented with a colored line on the graph: