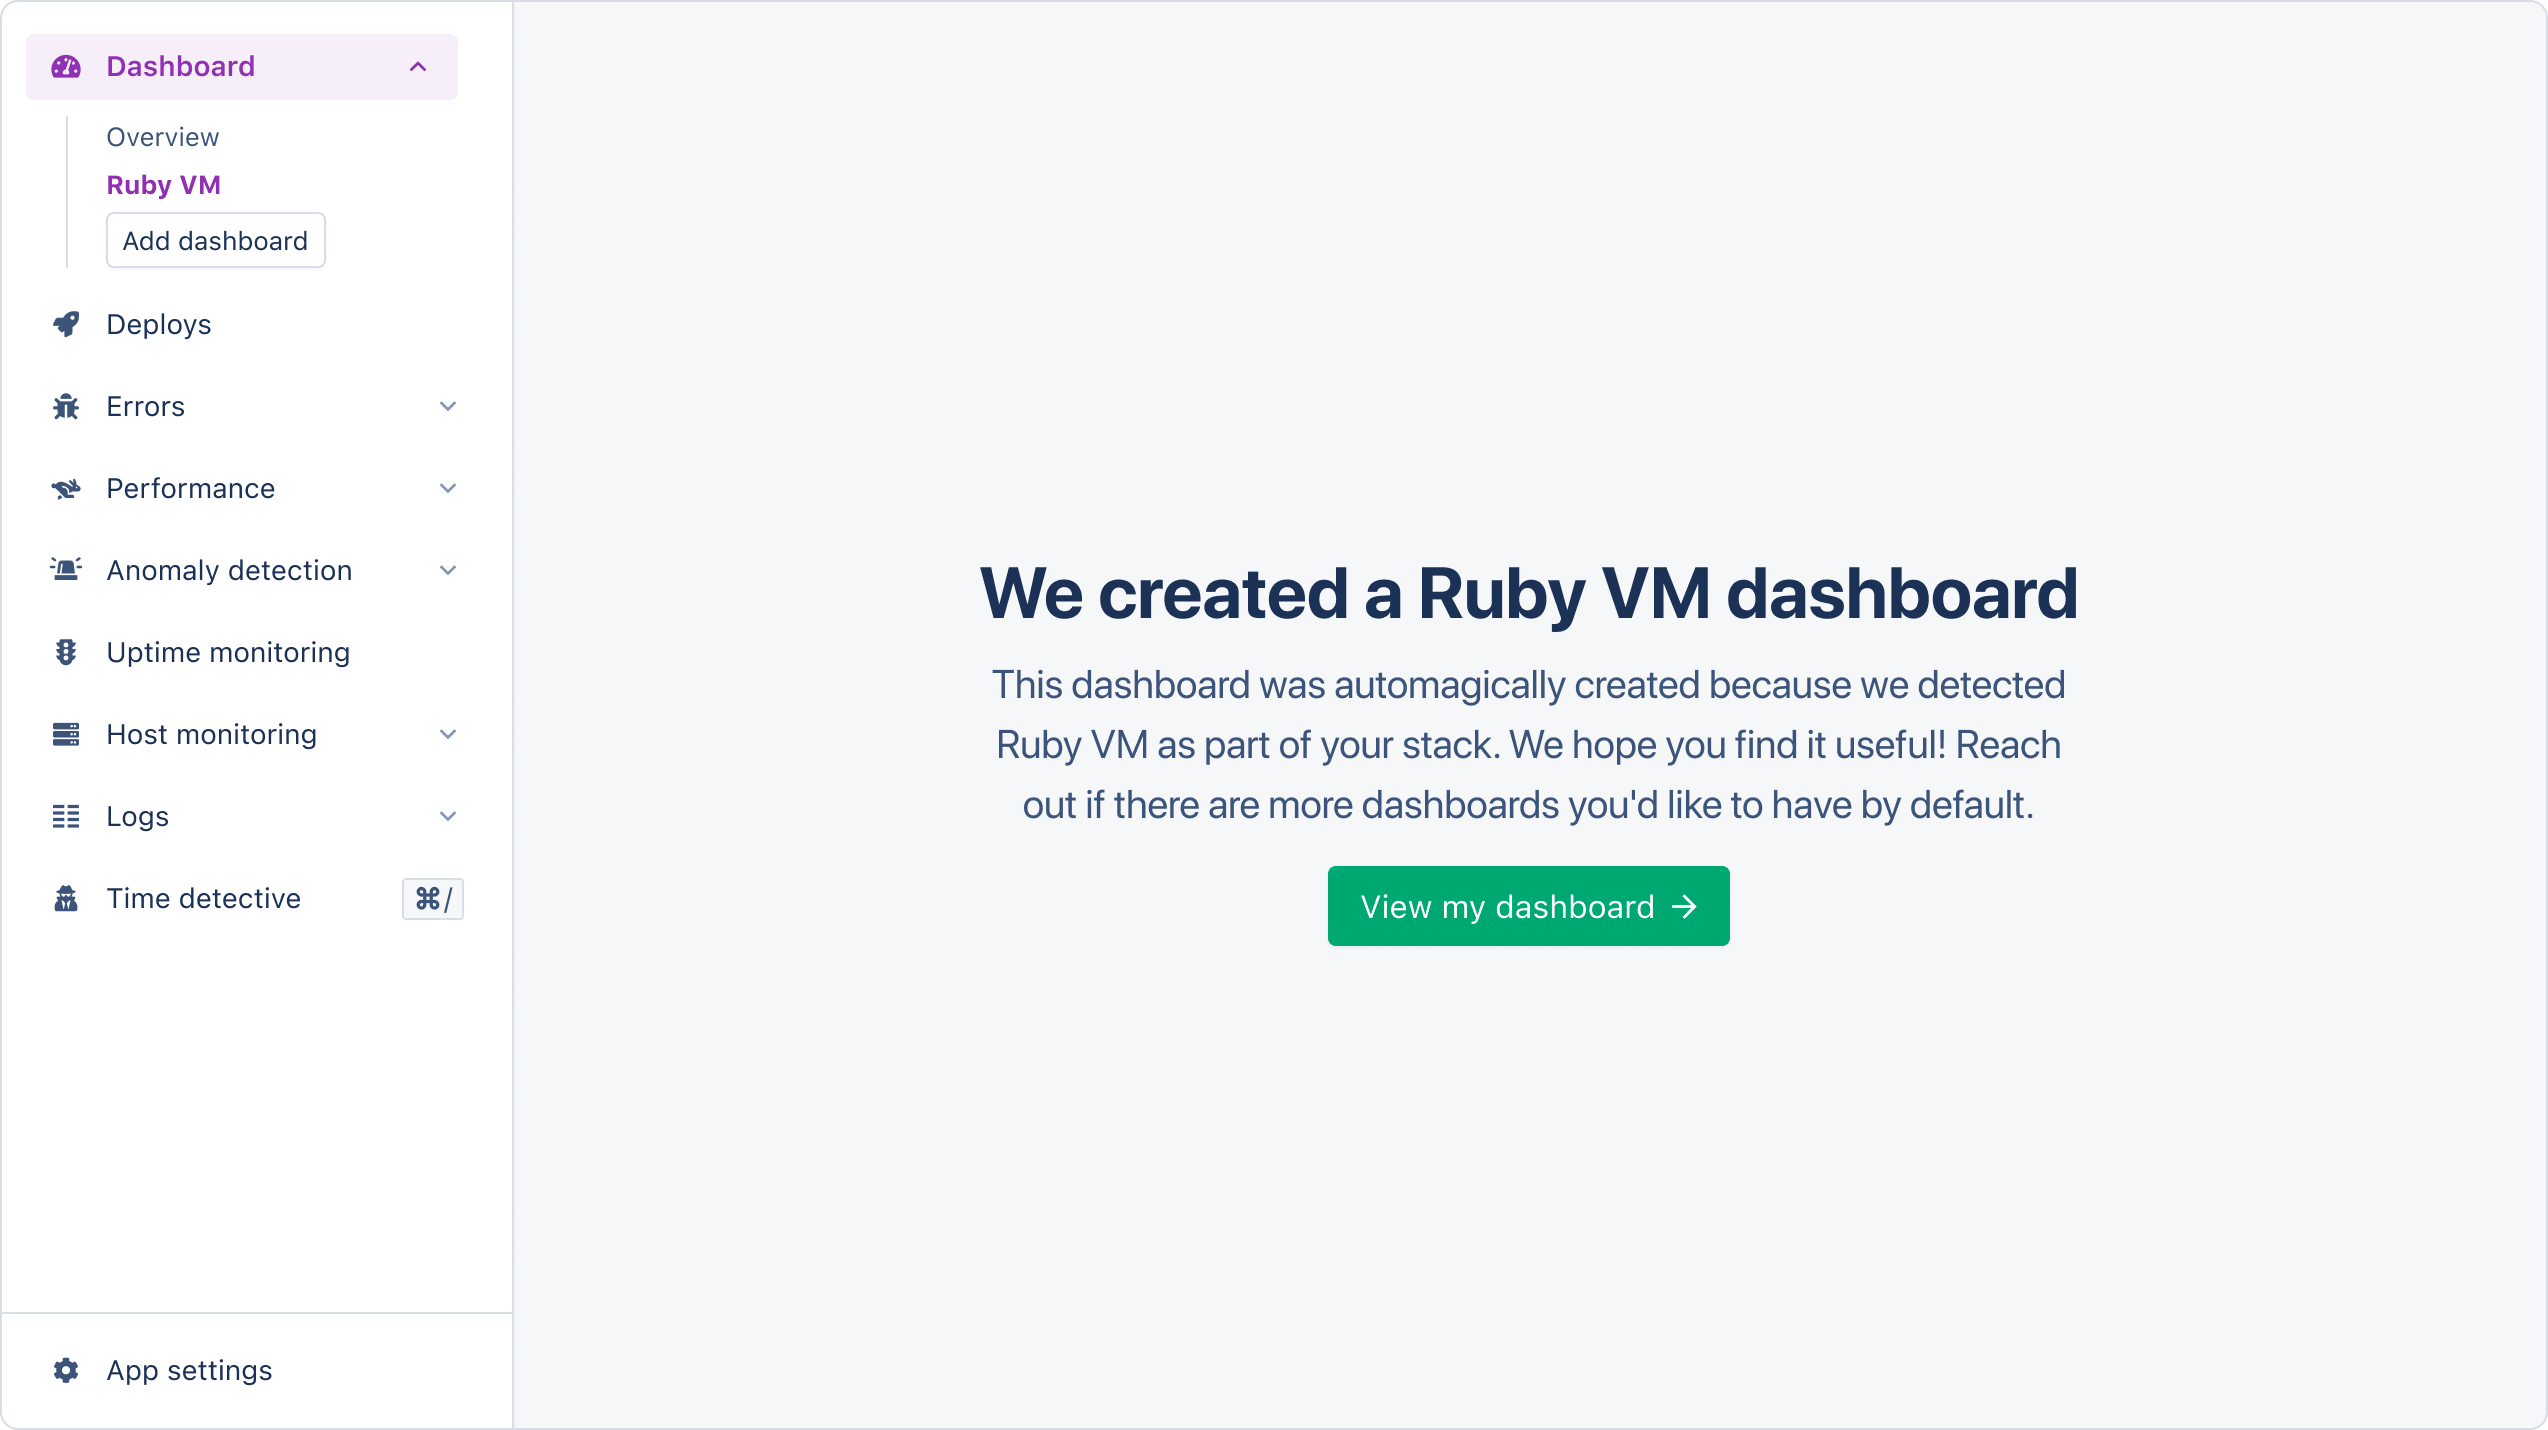
The Ruby VM (Virtual Machine) schedules Ruby threads for execution. At any given point, only one thread at a time can interact with the state of the Ruby VM.AppSignal supports Ruby VM out of the box. When AppSignal detects Ruby VM metrics, it will create an Intelligence dashboard, allowing you to monitor core metrics visually.
The Allocated objects graph shows how many complex Ruby values (objects, not strings, integers, booleans, etc.) are using memory in the Ruby virtual machine.You can use the Allocated objects graph to monitor and optimize your application’s memory usage and performance.
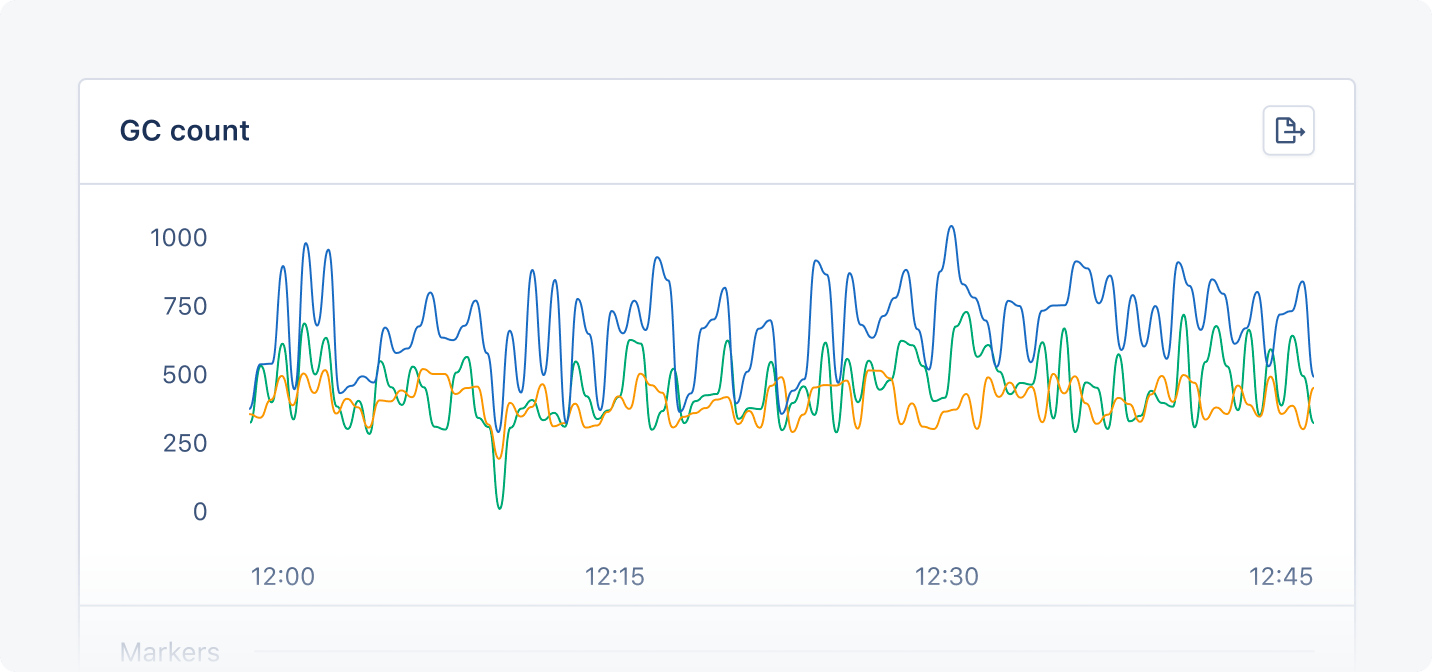
The GC counts graph shows the amount of garbage collection events/runs during the last minute, split between major and minor events.You can use the GC counts graph to monitor the frequency of garbage collection and its impact on your application’s performance and memory usage.
The Heap slots graph shows the heap slots currently allocated by the Ruby virtual machine, split between live and free slots.You can use the Heap slots graph to monitor memory allocation and identify the potential causes of memory leaks or fragmentation.
The metrics constant_cache_misses and constant_cache_invalidations are
only available in Ruby versions 3.2.0 and higher.
The Ruby VM graph shows statistics from the RubyVM.stat method about the constant cache and the classes created in your application.You can use the Ruby VM graph to monitor the cache status of constant values and how your application affects the Ruby VM state.
The Thread count graph shows the number of threads currently executing in your application.You can use the Thread count graph to monitor your application’s threading. Ruby VM Lock runs serially, meaning it can only execute one thread at a time. A high thread count may lead to performance problems.
Was this page helpful?
⌘I
Assistant
Responses are generated using AI and may contain mistakes.