
Installation
For AppSignal to be able to obtain Global VM Lock metrics, you must add thegvltools library to your project:
Intelligence dashboards
Intelligence dashboards will appear in the Dashboard section of AppSignal.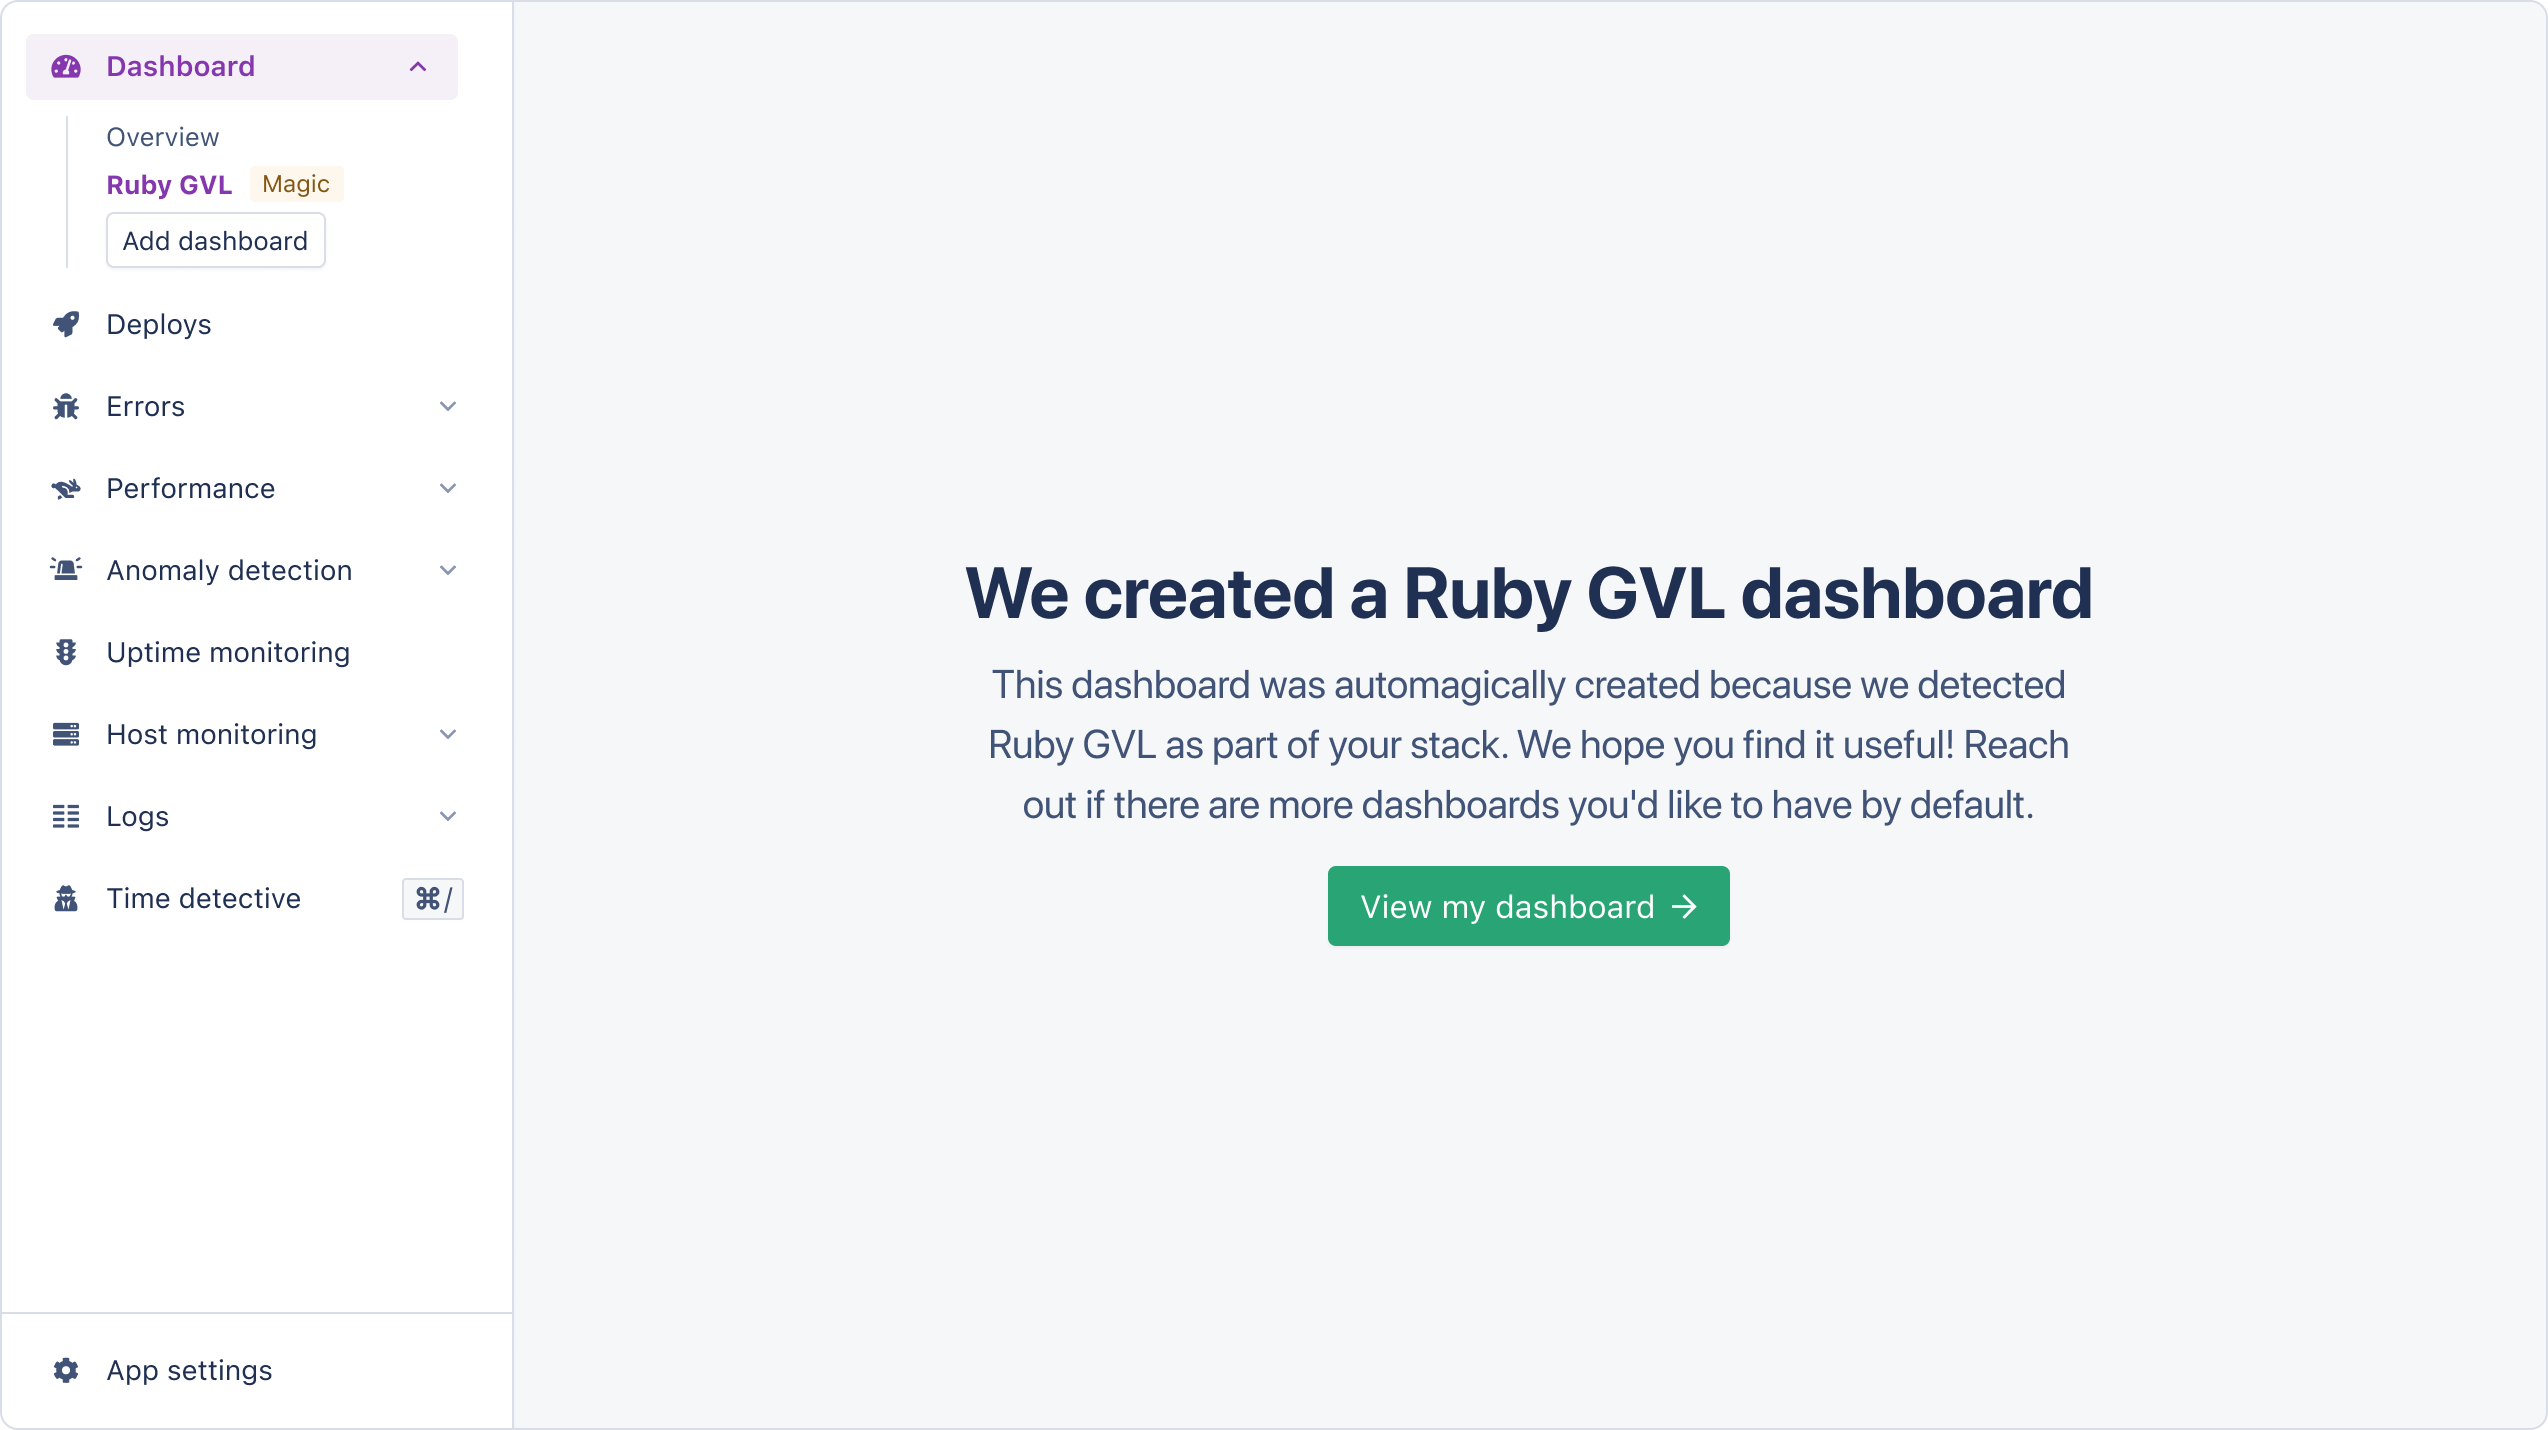
AppSignal reports the following tags for Global VM Lock metrics:
Global timer graph
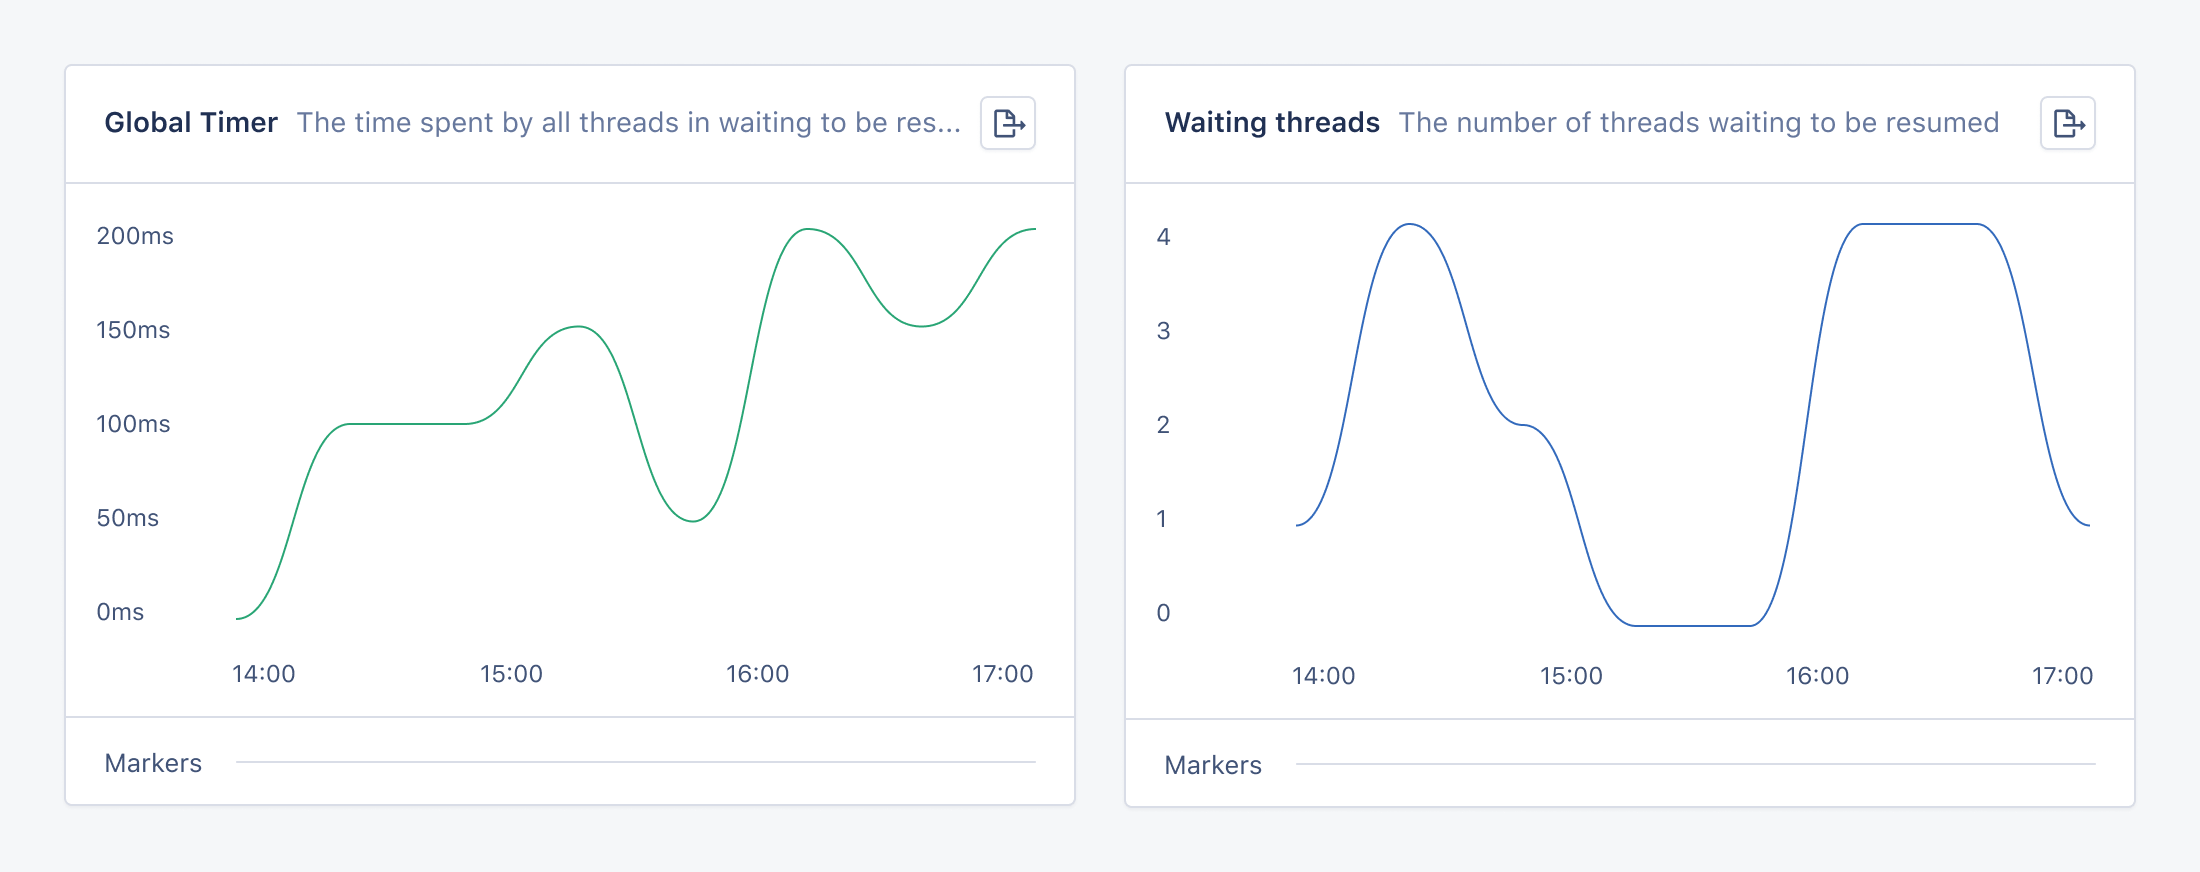
The global timer graph shows the time that threads spent waiting to be resumed during the last minute, that is, waiting for their code to be executed again.Configuring global timer measurement
Measuring the global timer has an estimated performance overhead of 5%. To prevent negative impacts on your application’s performance, you may want to disablegvl_global_timer by default and enable it when needed for specific requests or thread-intensive jobs.
To disable this metric at start time, set the enable_gvl_global_timer configuration option to false.
Then, you can use the gvltools library to enable and disable the global timer measurement without having to restart your application:
Waiting threads graph
The waiting threads graph shows the number of threads waiting to be resumed at any given time. The graph does not include threads that are not ready to be resumed, such as threads that are sleeping or awaiting an I/O event. To disable this metric, you can set theenable_gvl_waiting_threads configuration option to false.