You can track custom metrics in graphs in your AppSignal dashboards.
Gauge
A gauge records a value at a specific point in time. If you report multiple gauges with the same key within the same time window, only the last value is persisted. Use gauges when you want to know the current state of something — the number of items that exist right now, or the current size of a resource. All AppSignal host metrics are stored as gauges. Gauges are often used with minutely probes to periodically report a snapshot value, such as querying the number of recently active shopping carts or open database connections every minute. Examples: active user count, database size, disk usage, number of open connections.Measurement
A measurement tracks a spread of values over time. AppSignal stores the average and count for each time window, letting you graph things like average duration, 90th/95th percentile, and throughput. Use measurements when you are recording a value that varies across individual events and you want to understand its distribution — not just its current value. For example, you can track the duration of a critical background job (such as order confirmation emails) to spot slowdowns before they affect your users. A measurement metric creates several metric fields:- Count: how many times the helper was called. Useful for throughput graphs.
- Mean: the average metric value for the point in time.
- 90th percentile: the 90th percentile of the metric value for the point in time.
- 95th percentile: the 95th percentile of the metric value for the point in time.
Counter
A counter accumulates a total count over a time window. Counter values are summed for each resolution — so at minutely resolution it shows the total for that minute, and at hourly resolution it shows the total for that hour. Use counters when you want to track how many times something happened, not what value it had. Counters are especially useful for monitoring the frequency of business-critical events. For example, by tracking both orders placed and invoices created, you can verify that these related counters stay in sync and catch discrepancies early. When the helper is called multiple times, the total/sum of all calls is persisted. Counters are non-monotonic: both positive and negative values are supported, so you can increment and decrement the same counter. For monotonic counters from other systems, there is no validation that counter values only ever increase. Examples: orders placed, invoices created, user logins, background jobs queued, failed payment attempts.Metric naming
We recommend naming your metrics something easily recognizable. While you can wildcard parts of the metric name for dashboard creation, we recommend you only use this for small grouping and not use IDs in metric names. Metric names only support numbers, letters, dots and underscores ([a-z0-9._]) as valid characters. Any other characters will be replaced with an underscore by our processor. You can find the list of metrics as processed on the “Add Dashboard”.
Some examples of good metric names are:
database_sizeaccount_countusers.countnotifier.failednotifier.performnotifier.success
Metric values
Metrics only support numbers as valid values. Any other value will be silently ignored or will raise an error as triggered by the implementation language number parser. For Ruby and Elixir we support a double and integer as valid values:number type is a valid value.
Value formatting
AppSignal graphs have several display formats, such as numbers, file sizes, durations, etc. These formats help in presenting the metric values in a human-readable way. Selecting a value formatter input does not affect the data stored in our systems, only how it’s displayed. To show metric values correctly using these formatters, please check the table below how the value should be reported.File size
Metric values that represent a file size can use the file size formatter. To specify which unit of size the reported value is the file size formatter allows for several input values. The available options are:Size in BitSize in BytesSize in KilobitsSize in KilobytesSize in Megabytes
Size in Bitwill render “128 Bytes”Size in Byteswill render “1 KB”Size in Kilobitswill render “128 KB”Size in Kilobyteswill render “1 MB”Size in Megabyteswill render “1 GB”
Metric tags
A single metric can consist of various groups of data; for example, a ‘total_orders’ custom metric could consist of pending and processed orders. You can add multiple tags to metrics for deeper insights into the metric data AppSignal is reporting. Each tag will be represented by its line on an AppSignal graph. By default, the AppSignal metric helpers do not set tags on a custom metric. How you can use tags in AppSignal graphs: Tags can “label” a line in the graph legend, making it easier to see what each line represents when you hover your mouse over them. Filtering with tags can show the same metric in different contexts on different graphs. To get the most out of metric tags, we advise the following:- Be consistent with tagging: For optimal tracking and graph legibility, we advise against reporting a custom metric both with and without tags. Reporting the same metric in different ways can create confusion and make it difficult to interpret the data accurately.
- Always use the same metric tags when: We recommend using the same combination of tags whenever you report a metric. For example, if a metric uses tags A and B in one area of your app, it should use them in all areas. Avoid changing the tags, as consistent tagging will make graphing easier.
- Use a limited range of values for metric tags: To avoid overly complex or illegible graphs, we recommend using a limited range of tags on your custom metrics, such as regions (EU, US, and Asia). You can perform a broader analysis of your app’s metric data when using a limited and precise range of tags for all of your app metric data.
Rendering metric with and without tags
If you created a custom metric and you have multiple tags associated with it, you can render the metric with and without the tag at the same time in a graph.Graphing Custom Metrics
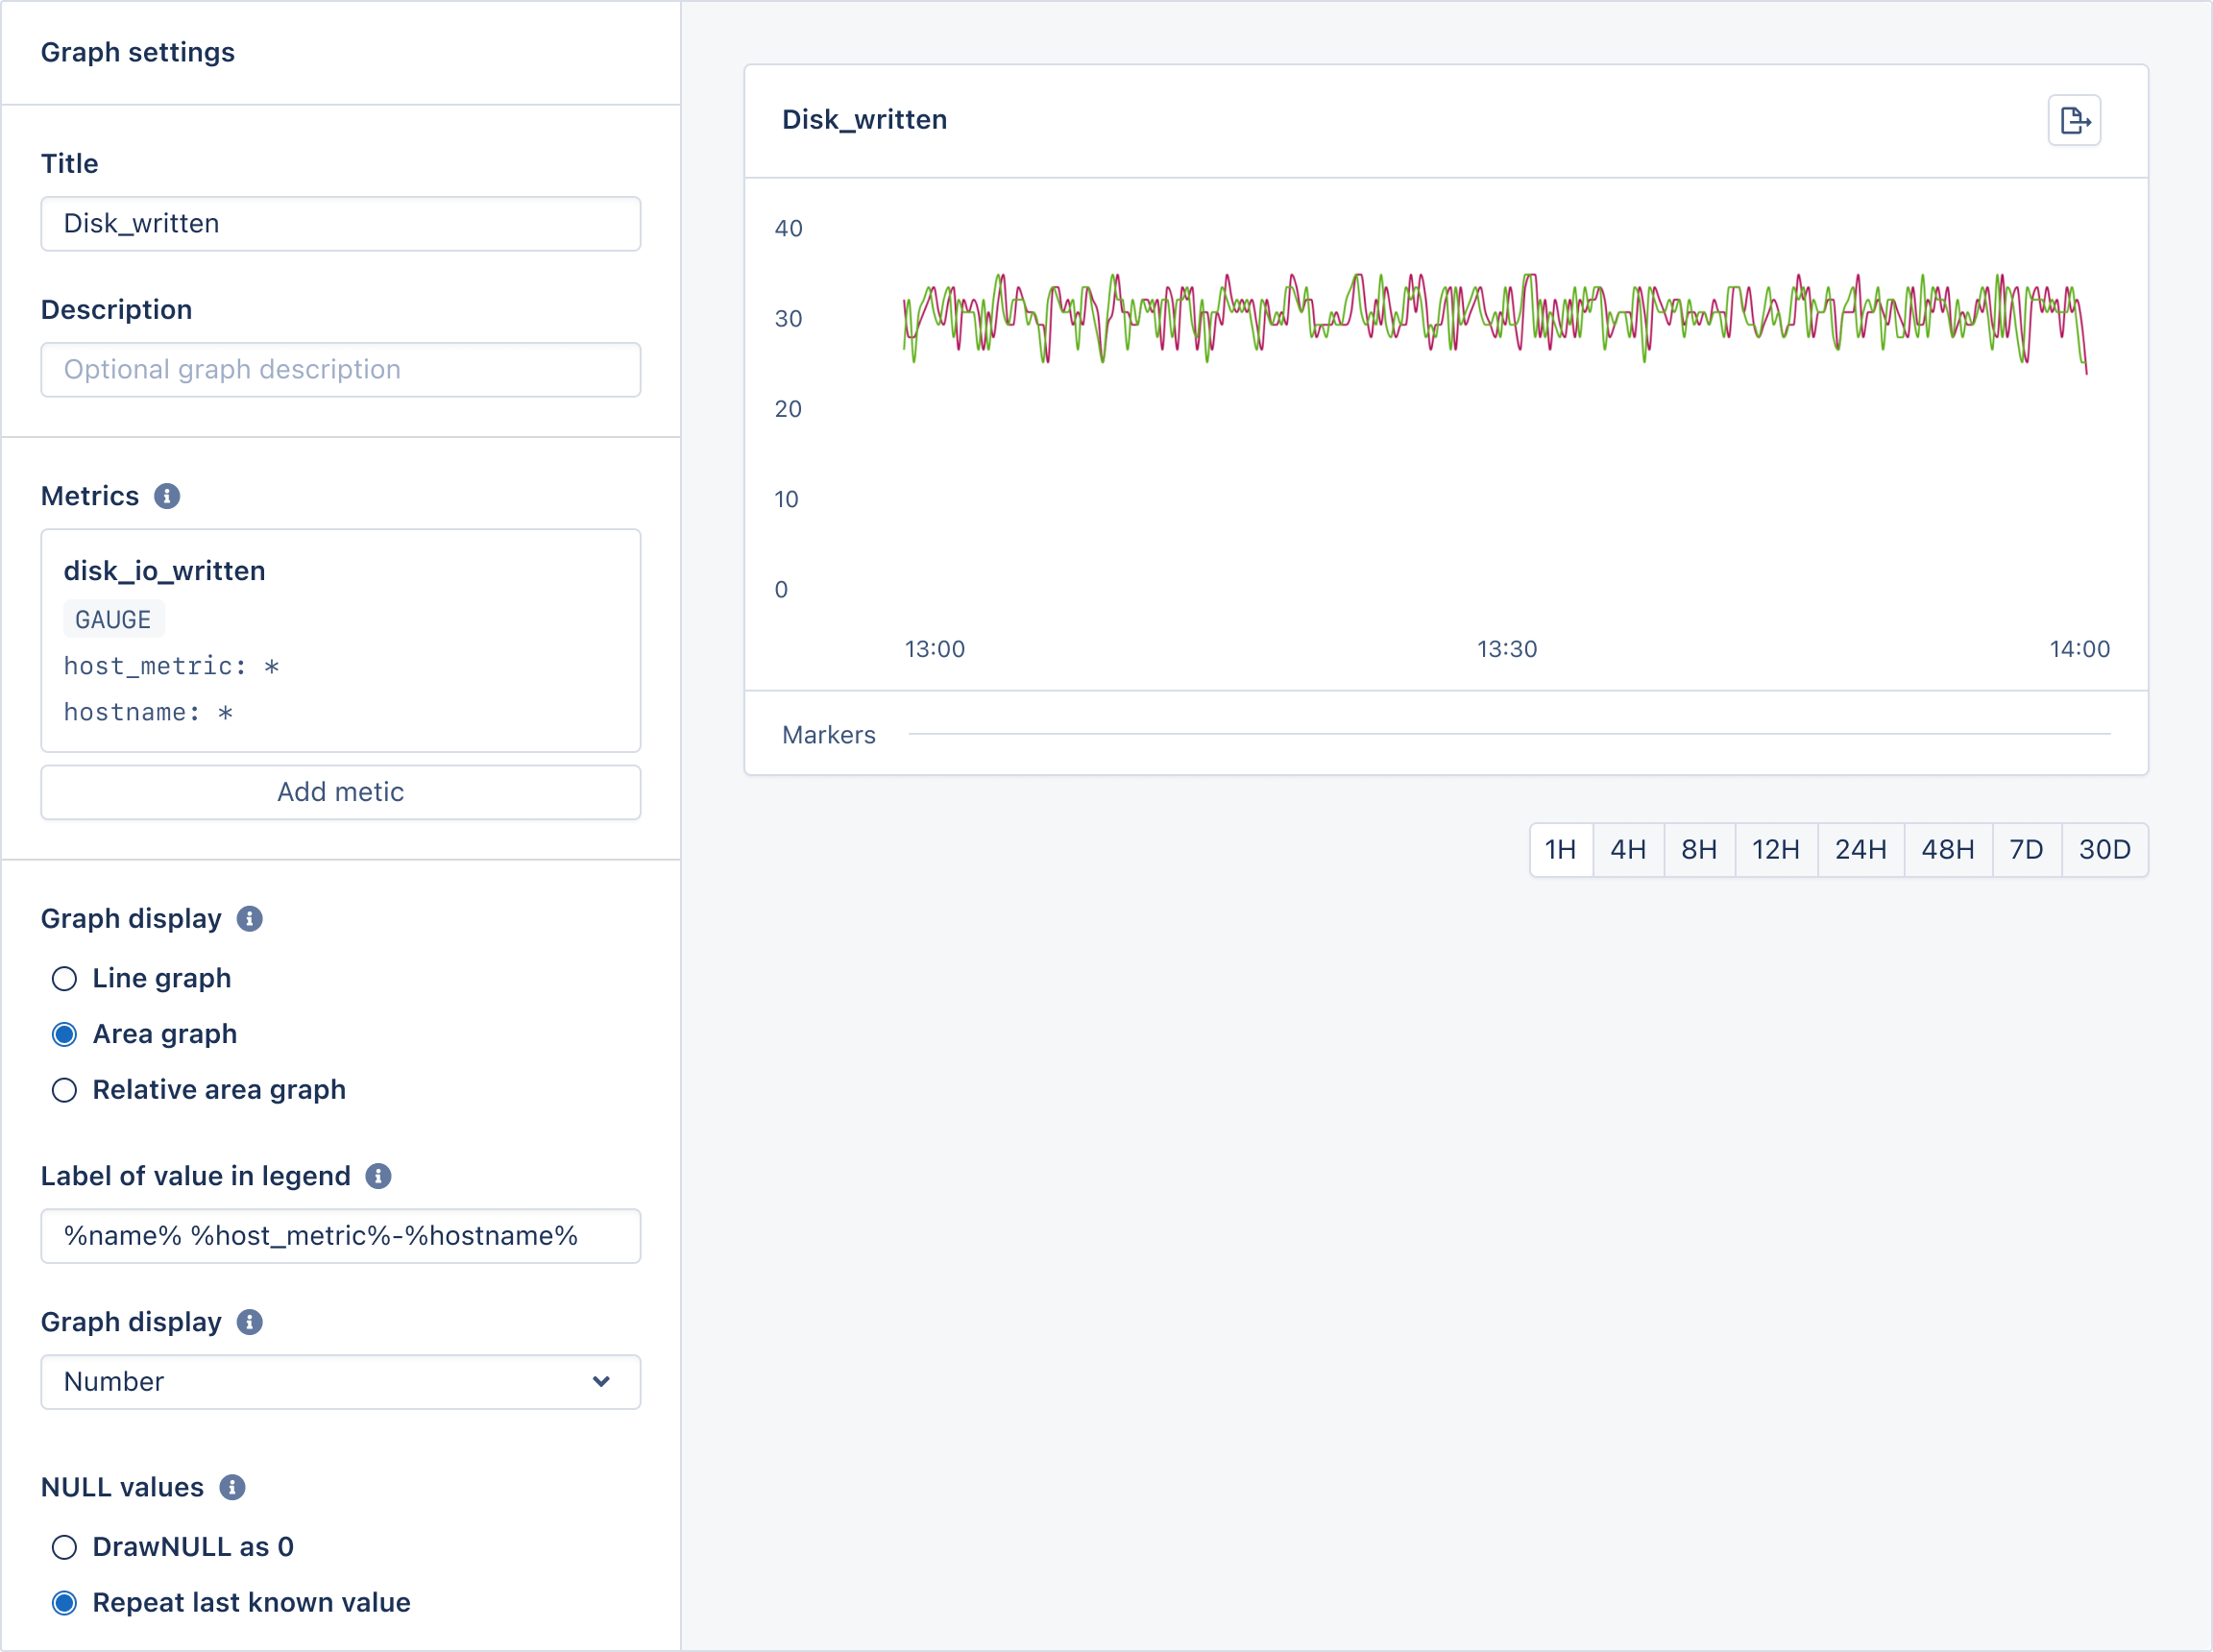
Once you’ve started recording custom metrics, you can track them in custom graphs using the Graph Builder. Navigate to an existing dashboard or use the “Add dashboard” button in the Dashboard navigation to create a new one, then click “Add graph”.