
Ecto query events are attached to the current AppSignal transaction. Phoenix
and Plug applications start this transaction automatically for each request.
In pure Elixir projects, no transaction is started for you, so query events
are only reported once you start one yourself. See Starting new
transactions.
Automatic instrumentation
The Ecto instrumentation automatically hooks into your Ecto repos if the:otp_app configuration is configured to your app’s OTP app name. The installer automatically configures this for you.
config/config.exs:
Disable automatic instrumentation
To disable automatic Ecto instrumentation, set theinstrument_ecto config option to false.
Instrumenting Ecto preloads
Since Ecto preload queries internally use several Elixir processes to carry out the different database queries involved, some manual changes to your codebase are necessary for AppSignal to properly instrument them. At the top of your Ecto repo module, replaceuse Ecto.Repo with use Appsignal.Ecto.Repo, as in the following example:
default_options/1 function, make sure to call super within it to merge its default options with those of AppSignal’s Ecto repo instrumentation:
Manual handler attachment
For repos that aren’t listed in the:ecto_repos configuration, you can attach a handler manually when starting your app’s supervisor. In most applications, this is done in your application’s start/2 function.
Appsignal.Ecto.attach/2. The first argument is the name of the OTP app that the repo belongs to, and the second argument is the repo’s module.
Metrics
In addition to instrumenting your Ecto queries, AppSignal for Elixir collects metrics about your Ecto repos’ performance:-
ecto_query_time: The time the database spends executing each query, tagged byrepoandhostname, and for each table byrepoandsource. -
ecto_queue_time: The time spent waiting for a database connection from the pool, tagged byrepoandhostname. -
ecto_decode_time: The time spent decoding query results into Elixir terms, tagged byrepoandhostname, and for each table byrepoandsource. -
ecto_idle_time: The time the connection sat idle in the pool before being checked out, tagged byrepoandhostname. -
ecto_total_time: The sum of queue, query, and decode time, tagged byrepoandhostname, and for each table byrepoandsource.
- Query time: 95th percentile of time the database spent executing each query, per table.
- Throughput: number of queries per table.
- Total time: 95th percentile of total Ecto time (queue, query, and decode), per table.
- Decode time: mean time spent decoding query results into Elixir terms, per table.
- Queue time: 95th percentile of time spent waiting for a database connection from the pool, per host.
- Idle time: mean time connections sat idle in the pool before being checked out, per host.
- Total time per host: mean total Ecto time (queue, query, and decode), per host.
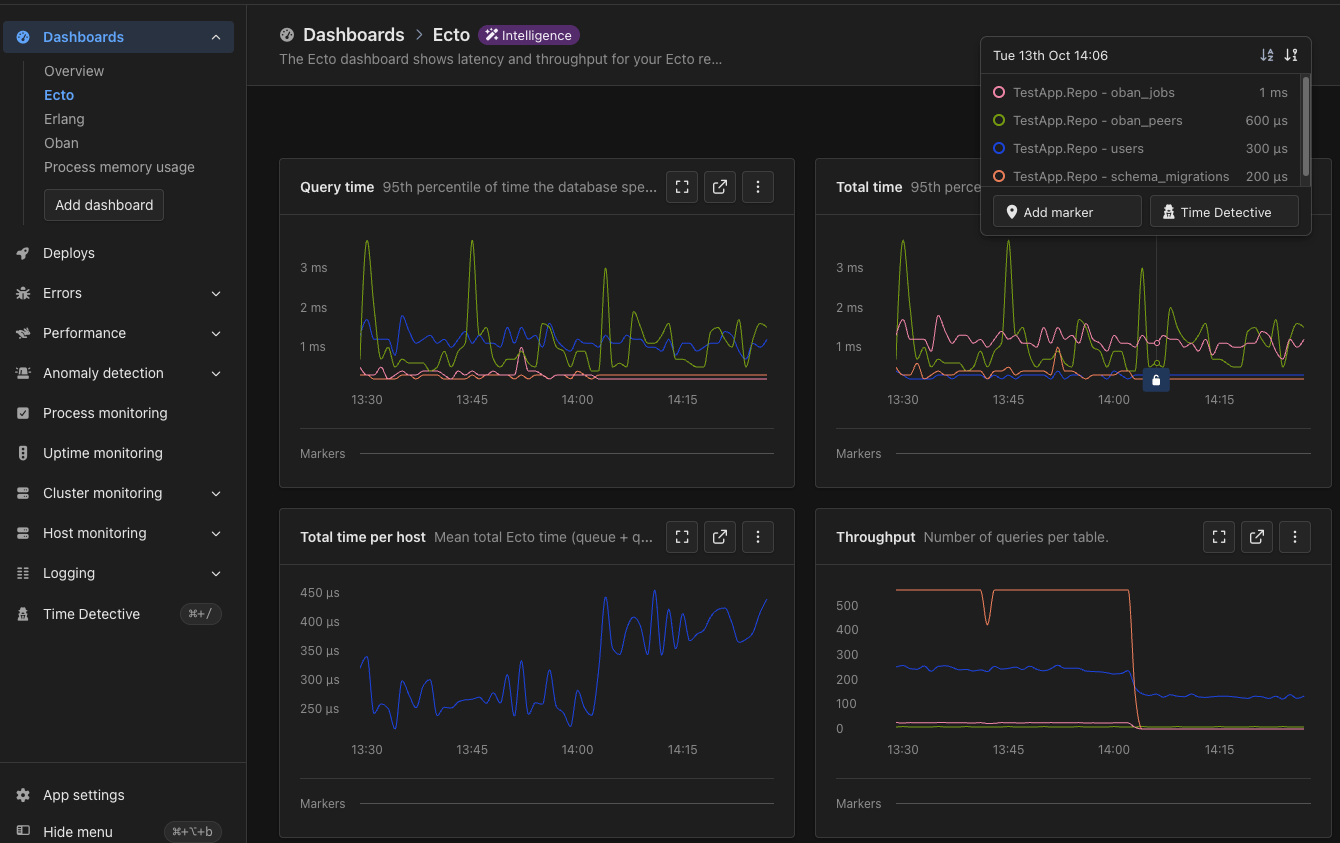
The Ecto Intelligence dashboard in AppSignal