Including custom instrumentation in your application can be helpful when identifying the specific lines of code causing performance problems.
AppSignal for Python uses OpenTelemetry tracer objects; you can read more about Python traces in OpenTelemetry’s Python Cookbook.
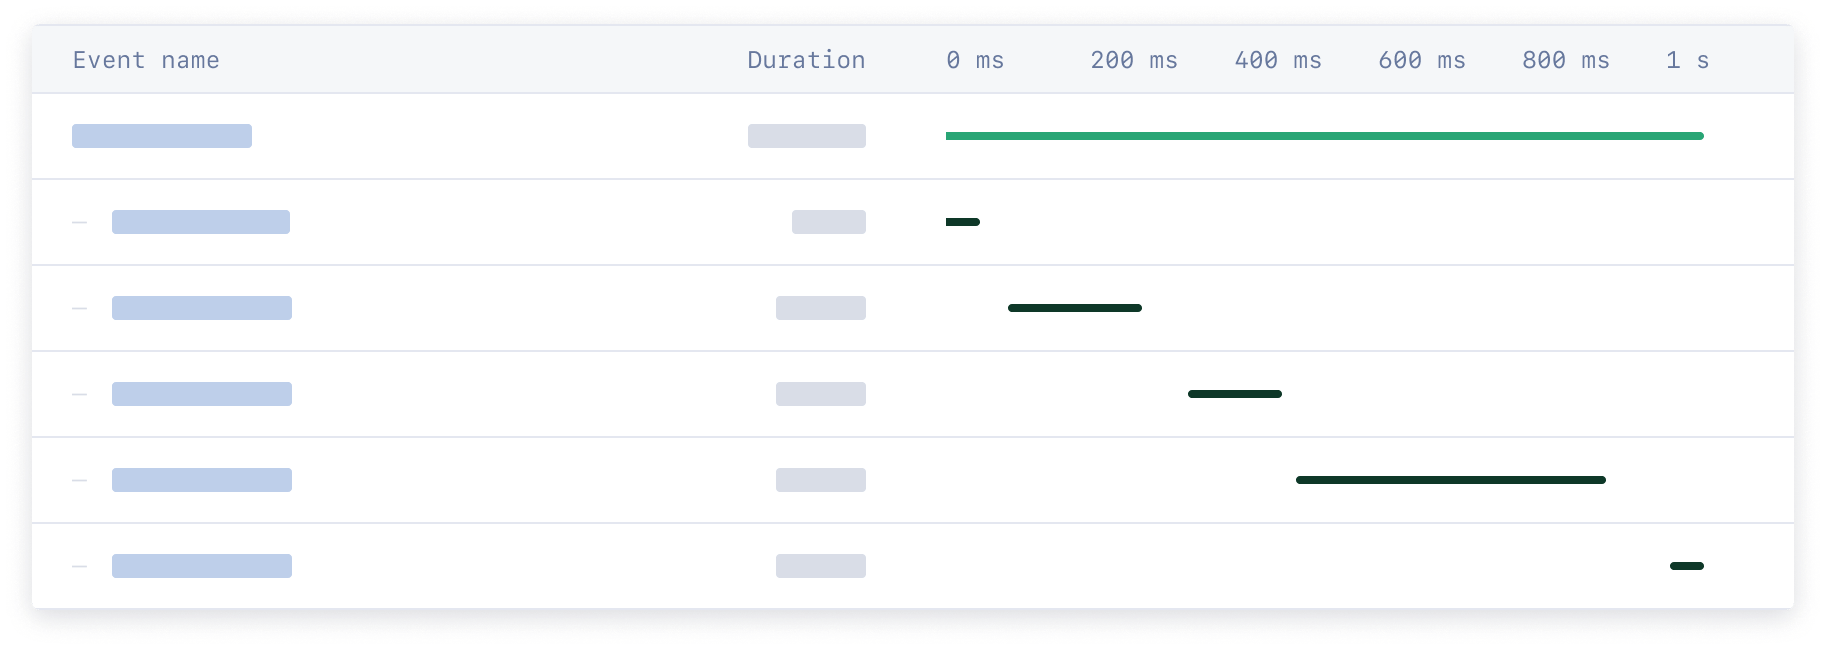
Traces are made of one or many spans. A Trace can be thought of as a directed acyclic graph (DAG) of spans:
 AppSignal specific attributes must be added to a span in order for it to be successfully parsed by AppSignal. Our set of helper methods can be used to set these attributes.
This documentation will explain how to create custom instrumentations by setting AppSignal specific attributes in your Python application’s spans.
AppSignal specific attributes must be added to a span in order for it to be successfully parsed by AppSignal. Our set of helper methods can be used to set these attributes.
This documentation will explain how to create custom instrumentations by setting AppSignal specific attributes in your Python application’s spans.
Creating a span
When adding custom instrumentation, first import the OpenTelemetry trace module in the file you want to add instrumentation to.
from opentelemetry import trace
tracer = trace.get_tracer(__name__)
with tracer.start_as_current_span("Span name"):
    # Here you can execute your app logic

    # And set AppSignal span details:
    from appsignal import set_category

    set_category("category.name")
One offs and Serverless
When running one-off scripts or serverless functions, you need to manually initialize AppSignal and stop it at the end to ensure no data is lost. The stop helper will gracefully kill the agent process and wait a while to ensure all data is sent to the AppSignal servers.
appsignal = Appsignal(
    active=True,
    name="My Python App",
    push_api_key="YOUR_PUSH_API_KEY",
)

appsignal.start()

# Your code here along with the instrumentation
# ...

appsignal.stop()
Helper methods
The following helper methods set AppSignal specific attributes on spans that help group spans and improve how they’re displayed in AppSignal. Other attributes are not supported on spans by AppSignal.
set_category
The span category is the name that appears in the performance event timeline for traces. It’s also used to group spans together to create a breakdown per group on the sample detail page.
from appsignal import set_category

set_category("category.name")
set_category("query.users")
set_category("update.users")
set_category("view.users")
.) to express the hierarchical inheritance of the event, with the highest unit last. For more information on span categories, please see the event names guide.
set_name
More details can be added to the span that are visible when hovering over the event in the event timeline. The span name is used to provide more information about the event, such as “Fetch users”, the database from which they are fetched or the URL that was requested.
from appsignal import set_name

set_name("Fetch users")
start_as_current_span was called.
set_body
🔐 Do not send Personal Identifiable Information (PII) to AppSignal. Filter PII (e.g., names, emails) and use an ID, hash, or pseudonymized identifier instead.
For HIPAA-covered entities, more info on signing a Business Associate Agreement (BAA) is available in our Business Add-Ons documentation. set_sql_body helper instead.
from appsignal import set_body

set_body("Span body")
set_sql_body
Available since Python package 0.3.2.
set_body helper, but is specialized for SQL queries. Any SQL query set as the body with this attribute will be sanitized to avoid sending PII (Personal Identifiable Information) data to our servers.
See the set_body helper for more details on how the body attribute works.
When both the set_body and set_sql_body helpers are called on the same span, the set_sql_body helper’s value is leading and the set_body helper’s value will be ignored.
from appsignal import set_sql_body

set_body("SELECT * FROM users")
set_root_name
This attribute applies to the entire trace. It can be set on a child span, and does not need to be set on the uppermost parent span. This attribute can only be set once per trace. If it is set multiple times, only the attribute from one span in the trace is applied.
set_root_name helper.
Use an action name generic enough to group all traces from this part of the app, while not reporting different names every time. Set GET /users/:id (where :id the URL parameter name) as the action name, instead of GET /users/123 (where 123 is the actual value made in the request). The latter would report a new incident for every unique request.
from appsignal import set_root_name

set_root_name("GET /custom")
# With URL parameters
set_root_name("GET /users/:id")
Example Use Case
Your application has an endpoint called GET /coffee.
def coffee(request):
  return render(request, "coffee.html", {})
GET /coffee, but your endpoint handles multiple actions: coffee?action=buy, and coffee?action=sell.
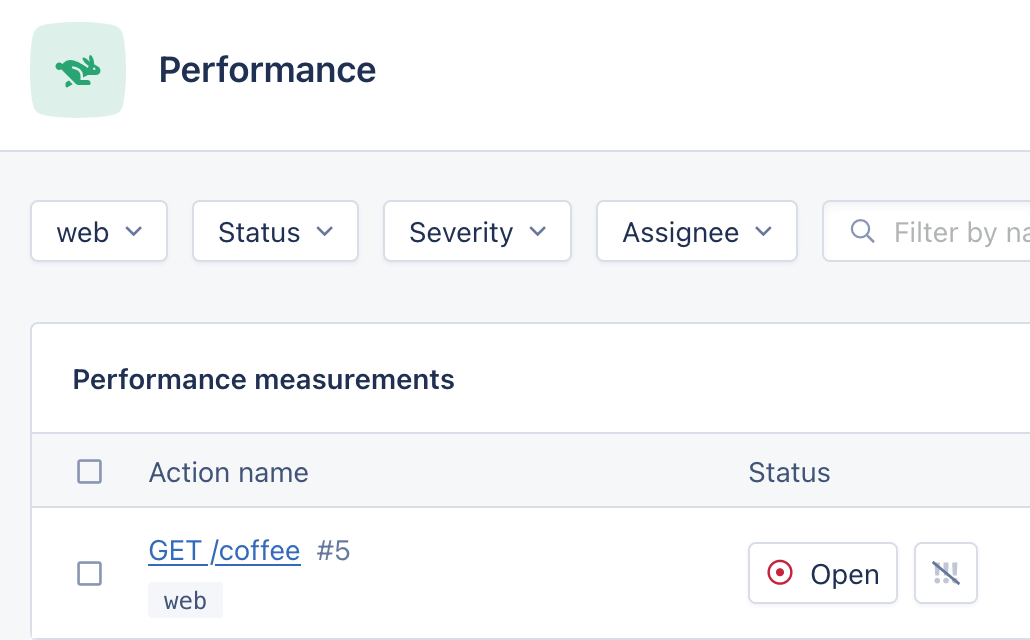 While they all use the
 GET /coffee endpoint, they are conceptually very different and so it would make sense for them to be grouped separately in AppSignal rather than in the same GET /coffee sample. To do this, you can use the set_root_name helper:
from appsignal import set_root_name

def coffee(request):
  if request.GET.action == "buy":
    set_root_name("Buy coffee")
    # Buy coffee...
  elif request.GET.action == "sell":
    set_root_name("Sell coffee")
    # Sell coffee...

  return render(request, "coffee.html", {})
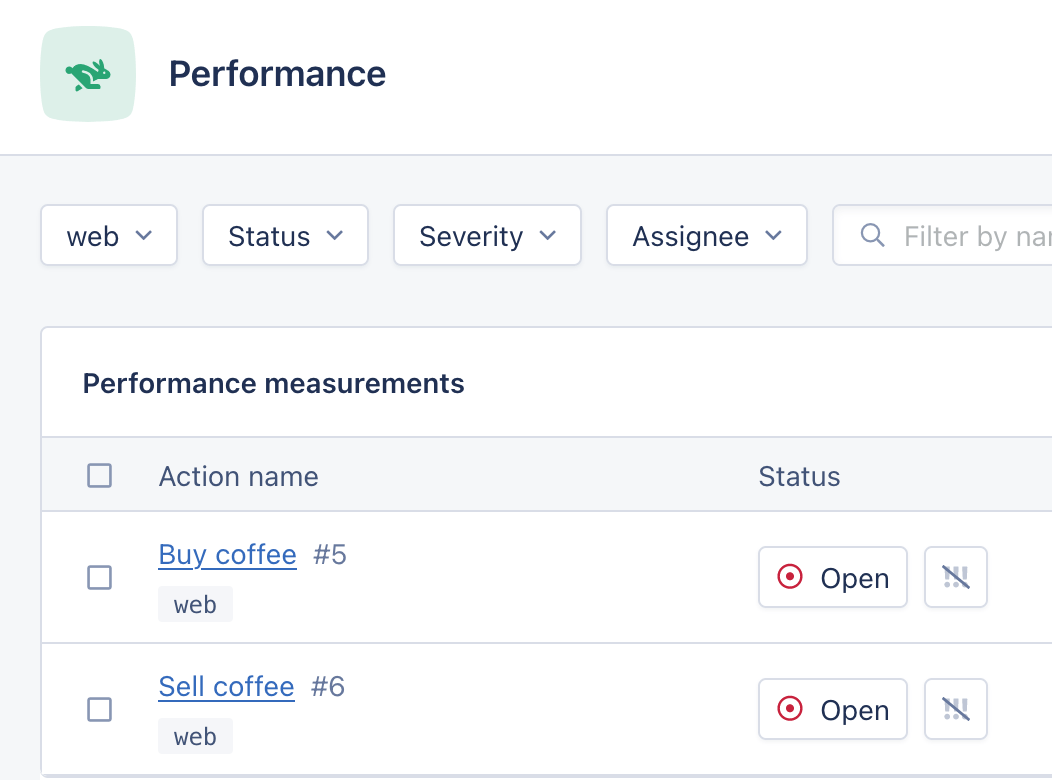
set_root_name will change the name of the root span, grouping the samples for the requests coffee?action=buy and coffee?action=sell into separate actions:
Other trace data
To customize the data stored on the trace even further, please see our Tagging and Data Customization guides to add tags, parameters, session data, custom data and more.