What you can do
With thedashboards permission set to write, an agent can:
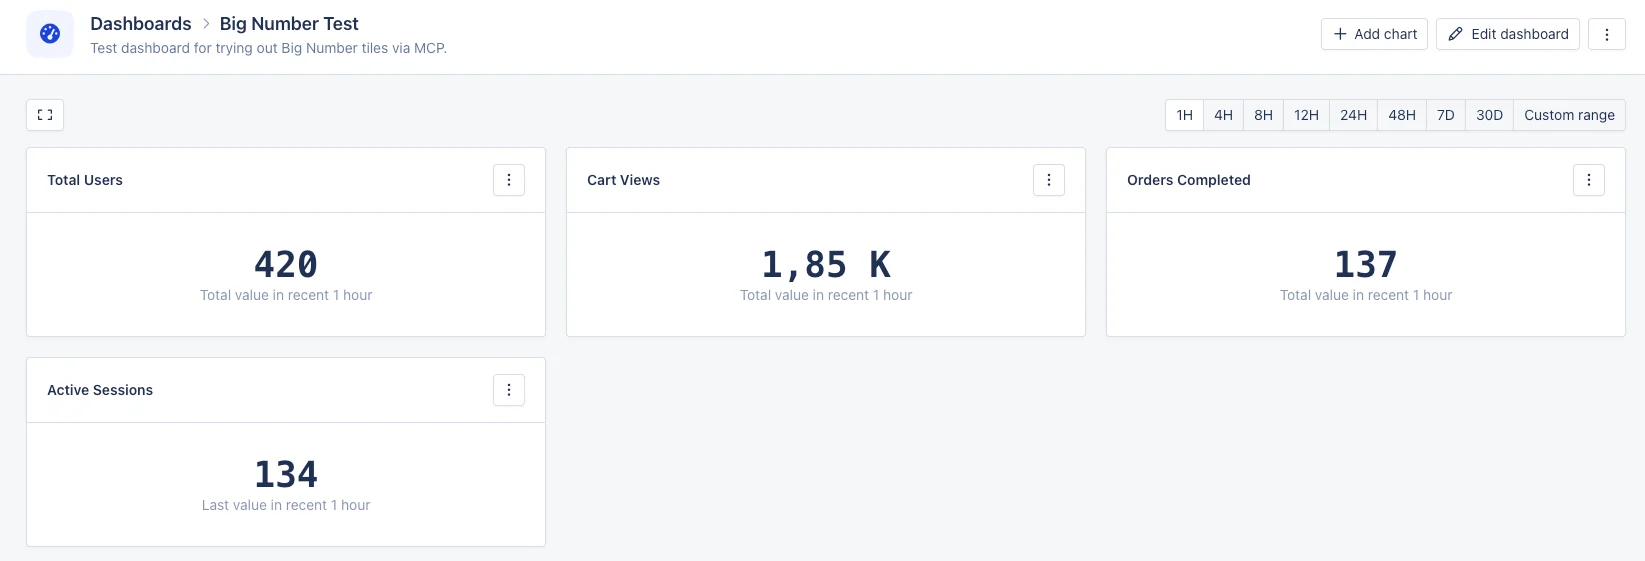
- Create a new dashboard to hold the chart (
manage_dashboard) - Add a Big Number chart to any dashboard (
create_dashboard_visualwithtype: "number") - Change the metric, aggregate, or formatting on an existing chart (
update_dashboard_visual)
Example prompt
Text
create_dashboard_visual call with:
type: "number"metric.name: "request_latency_ms"metric.field: "mean"metric.aggregate: "avg"format: "duration"
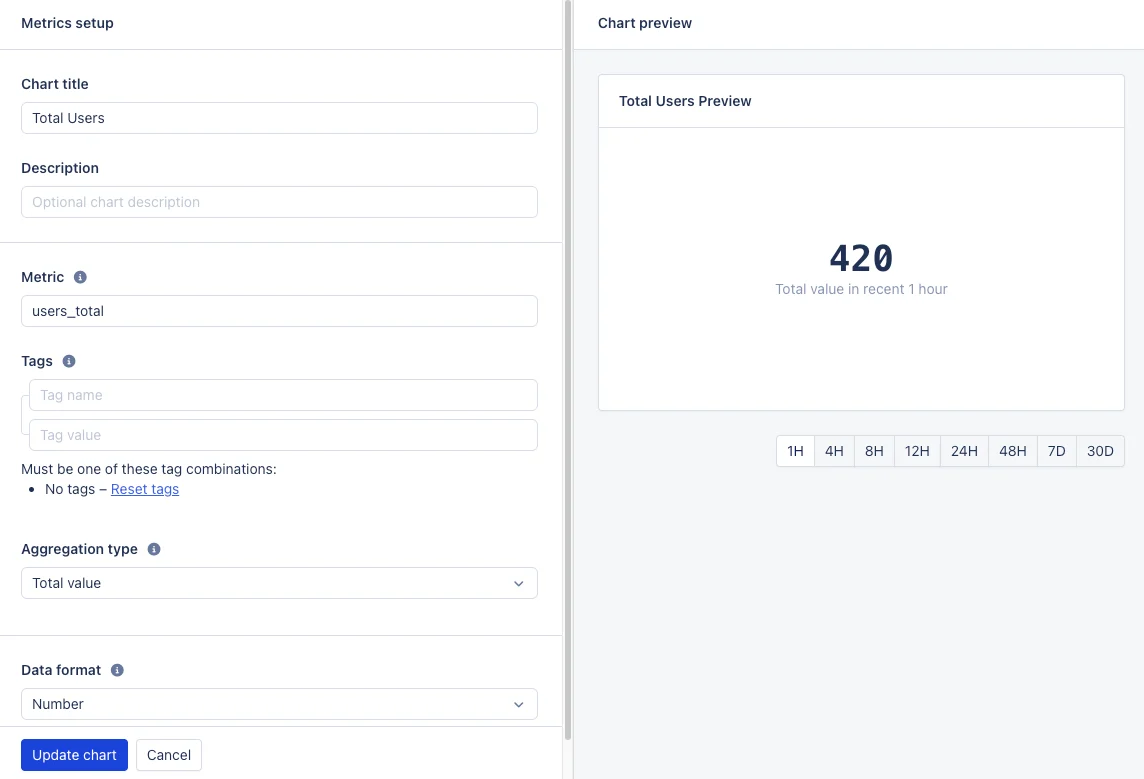
Configuring the chart
A Big Number chart needs one metric and one aggregation across the selected time range:-
Metric — The metric name to be shown in this chart. You can either use the full metric name to select one metric, or use a wildcard (_) to select multiple metrics at once:
db_users_document_count,db\__\_size. See metric naming for the full rules. -
Aggregation type — The aggregation used to display the metric value. The number on the chart is selected or calculated based on this aggregation, applied to the metric data reported in the selected time frame on the dashboard or preview:
Maximum value— the highest metric valueMinimum value— the lowest metric valueAverage value— the average of the metric valuesTotal value— the combined value of the metric valuesFirst value— the first metric valueLast value— the last metric value
- Data format — Select the value format that is used to display values in the chart and chart legends. See value formatting for the available formats.
-
Tags (optional) — Select which tags of the metric should be displayed in the chart:
- When empty, all variations of a tag will create their own line in the chart.
- Enter tags to filter for certain tag values. In this case, all tags of the metric need to be specified, either with a value or a wildcard.