
Browser monitoring is a beta AppSignal Labs feature. The
@appsignal/browser package is published under the beta tag on npm, and its
configuration and API may still change between beta releases. Share feedback
in our Discord community.POST https://api.example.com/orders: HTTP 503. You know the order request failed, but not why. The order service may have spent four seconds waiting on a database lock before returning 503. Distributed tracing lets you follow that request from the browser into the order service.
To connect the browser error to work in the order service, set up both sides:
- Browser: Add your API URL patterns to
tracePropagationTargets. Matching requests carry atraceparentheader. A 5xx response or qualifying timeout becomes a browser error. - Receiving API service: Instrument its HTTP server to read
traceparentand report spans through an AppSignal hosted collector. Use a supported integration or OpenTelemetry instrumentation for its framework.
Distributed tracing is a beta AppSignal Labs feature. The browser SDK needs no collector. The receiving service needs an AppSignal hosted collector for its spans.
Before you start
Choose the setup for the service that receives the browser request. Its HTTP server integration must readtraceparent, and the service must send spans through an AppSignal hosted collector:
- FastAPI: Install
opentelemetry-instrumentation-fastapiand use Python collector mode. - Rails: Use the
appsignalandappsignal-opentelemetrygems in collector mode. The Rails integration reads incoming traces. - Go or custom OpenTelemetry: Instrument your HTTP server and configure trace-context propagation. See availability and setup.
Enable it
Add a pattern for each API host and path totracePropagationTargets. The default empty list leaves tracing off:
fetch and XMLHttpRequest call. They ignore the scheme and query string. Use * within one path segment or ** across segments. Include both a host and a path:
In the trace timeline,
serviceName labels the browser error span. For example, Checkout UI identifies errors from your checkout front end. The default is Browser. Use a different name for each front end you monitor. The SDK sends the name with every error report.
The Browser SDK install flow offers Distributed tracing as an option. It is off by default. Selecting it adds tracePropagationTargets: ["api.example.com/**"] to the browser snippet. Replace the example host with your API host, then instrument the receiving service. The wizard does not install or configure that service.
To verify propagation, load a page that calls your API and inspect the request in your browser’s Network panel. A matching request should carry a traceparent header. Then inspect a failed request in AppSignal to check that back-end spans appear in its trace.
For a cross-origin API, such as api.example.com called from www.example.com, the browser may send a CORS preflight before the request. Allow traceparent in your API’s response to the preflight. Otherwise the browser may block the request:
no-cors mode, because the browser would strip it. Those requests are never reported as failed requests.
What is reported
The SDK reports these outcomes for a matching request that sent atraceparent header:
- A 5xx response is reported as an
HTTPError. - A timeout is reported as a
TimeoutError. That is afetchthat rejects with aTimeoutError, as one bounded byAbortSignal.timeout()does. It is also anXMLHttpRequestwhosetimeoutfires. The server may have received and traced a timed-out request.
POST https://api.example.com/orders: HTTP 503 or GET https://api.example.com/orders: timed out. Besides everything an ordinary browser error carries, the report includes:
- The request, as
params.request: theurl, themethod, thestatuswhen a response arrived, and theduration_ms. Query parameters are removed from the URL as set by your allowlist. - The span: the trace ID and span ID from the request’s
traceparent, with its start time and duration. AppSignal builds the browser’s span from these, so it covers the request as the browser saw it. After a timeout, the back end’s spans can run longer than the browser’s span. - The service name you set, or
Browser.
- A successful request. The header is sent, but the browser stays silent, so the back-end trace stands on its own.
- A 4xx response. The SDK does not classify it as a failed request for tracing.
- A request the browser could not deliver: refused, failed DNS, or blocked by an extension. No server handled it, so there is no back-end trace to join.
- A timeout while the device is offline, which says nothing about the back end.
- A request your code canceled.
privacy.networkBlocklist or breadcrumb collection is disabled. A breadcrumb for a request that propagated context includes its trace ID.
A failed request goes through the same pipeline as every other error. errors.enabled, errors.sampleRate, the rate limits, and the deduplication of repeats all apply. beforeError receives it as an HTTPError or TimeoutError, with the request under context.request. You can drop or redact it there. A request matching privacy.networkBlocklist is never reported.
The SDK avoids reporting the same fetch rejection twice when it also reaches an unhandled rejection handler or captureError(). If your code throws a new error after a 500 response, that error has its own trace. The failed request remains a separate report.
Reading it in AppSignal
Failed requests appear in the Errors view of the Browser section asHTTPError and TimeoutError issues. They are grouped by the route the user was on, like every other front-end error. Read more in front-end errors in AppSignal.
Open an issue to see its message, breadcrumbs, and tags. On the full issue page, select Traces. Then select Fullscreen in the Trace timeline card to open the view below. If the preview omits spans, the button reads All spans. From the Browser Errors side panel, Open full trace page takes you to the issue page.
In the fullscreen timeline, Browser labels the browser span’s service. Select that span to see the request and error details.
This example shows a product page where GET /api/boom/ returned HTTP 500. In the trace timeline, you can follow the failed request from the browser into the Django service:
Browsershows anHTTPErroron/product/chocolate-stroopwafel(85 ms). The selected span’s details show the request URL and HTTP 500 response.- Beneath it,
djangoshowsGET api/boom/with aRuntimeError(81 ms). - The Django request contains two
SELECTspans and aPOSTspan, with their durations.
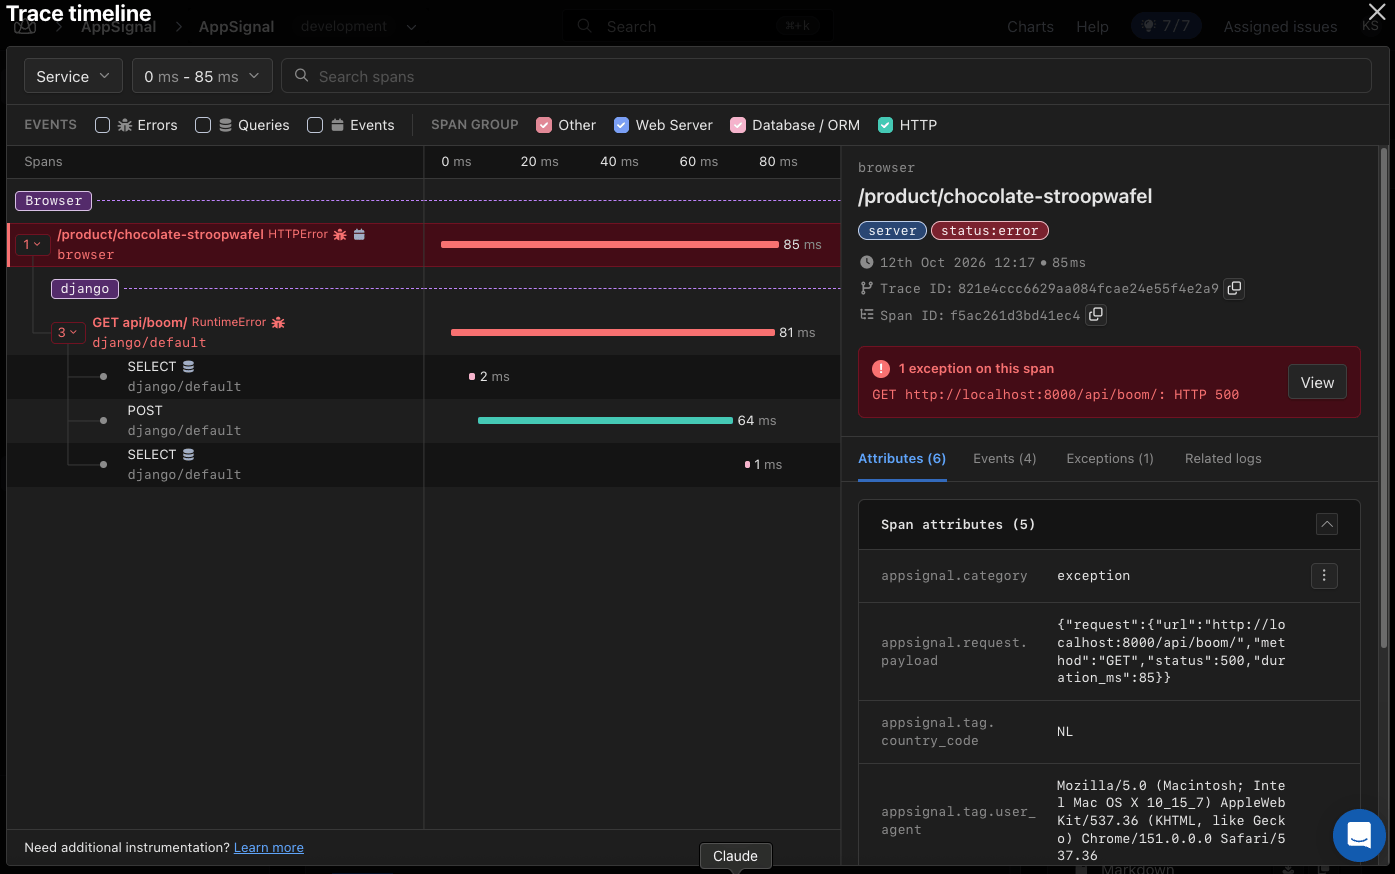
The failed browser request and related Django spans in one trace.
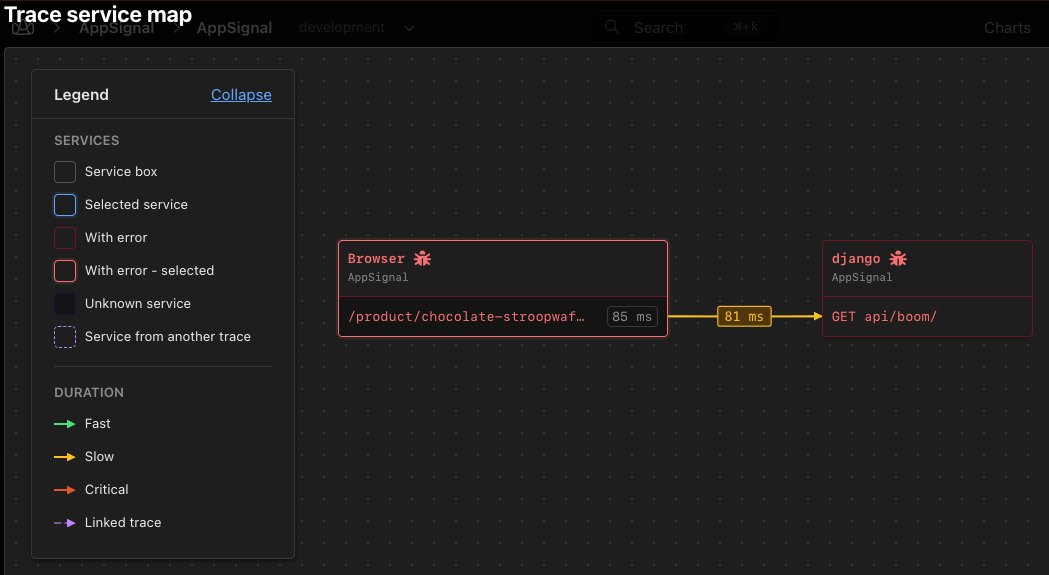
The service map for the same trace: the back-end error connected to the browser error that started it.
Joining a trace your code started
Your application may already set a validtraceparent on a request, for example through an OpenTelemetry browser SDK. AppSignal for Browser then leaves that header alone, and a failed request joins the trace your code started. This holds for fetch and XMLHttpRequest alike.
On the issue’s Traces tab, open the trace timeline in fullscreen to inspect the back-end work.