Setup
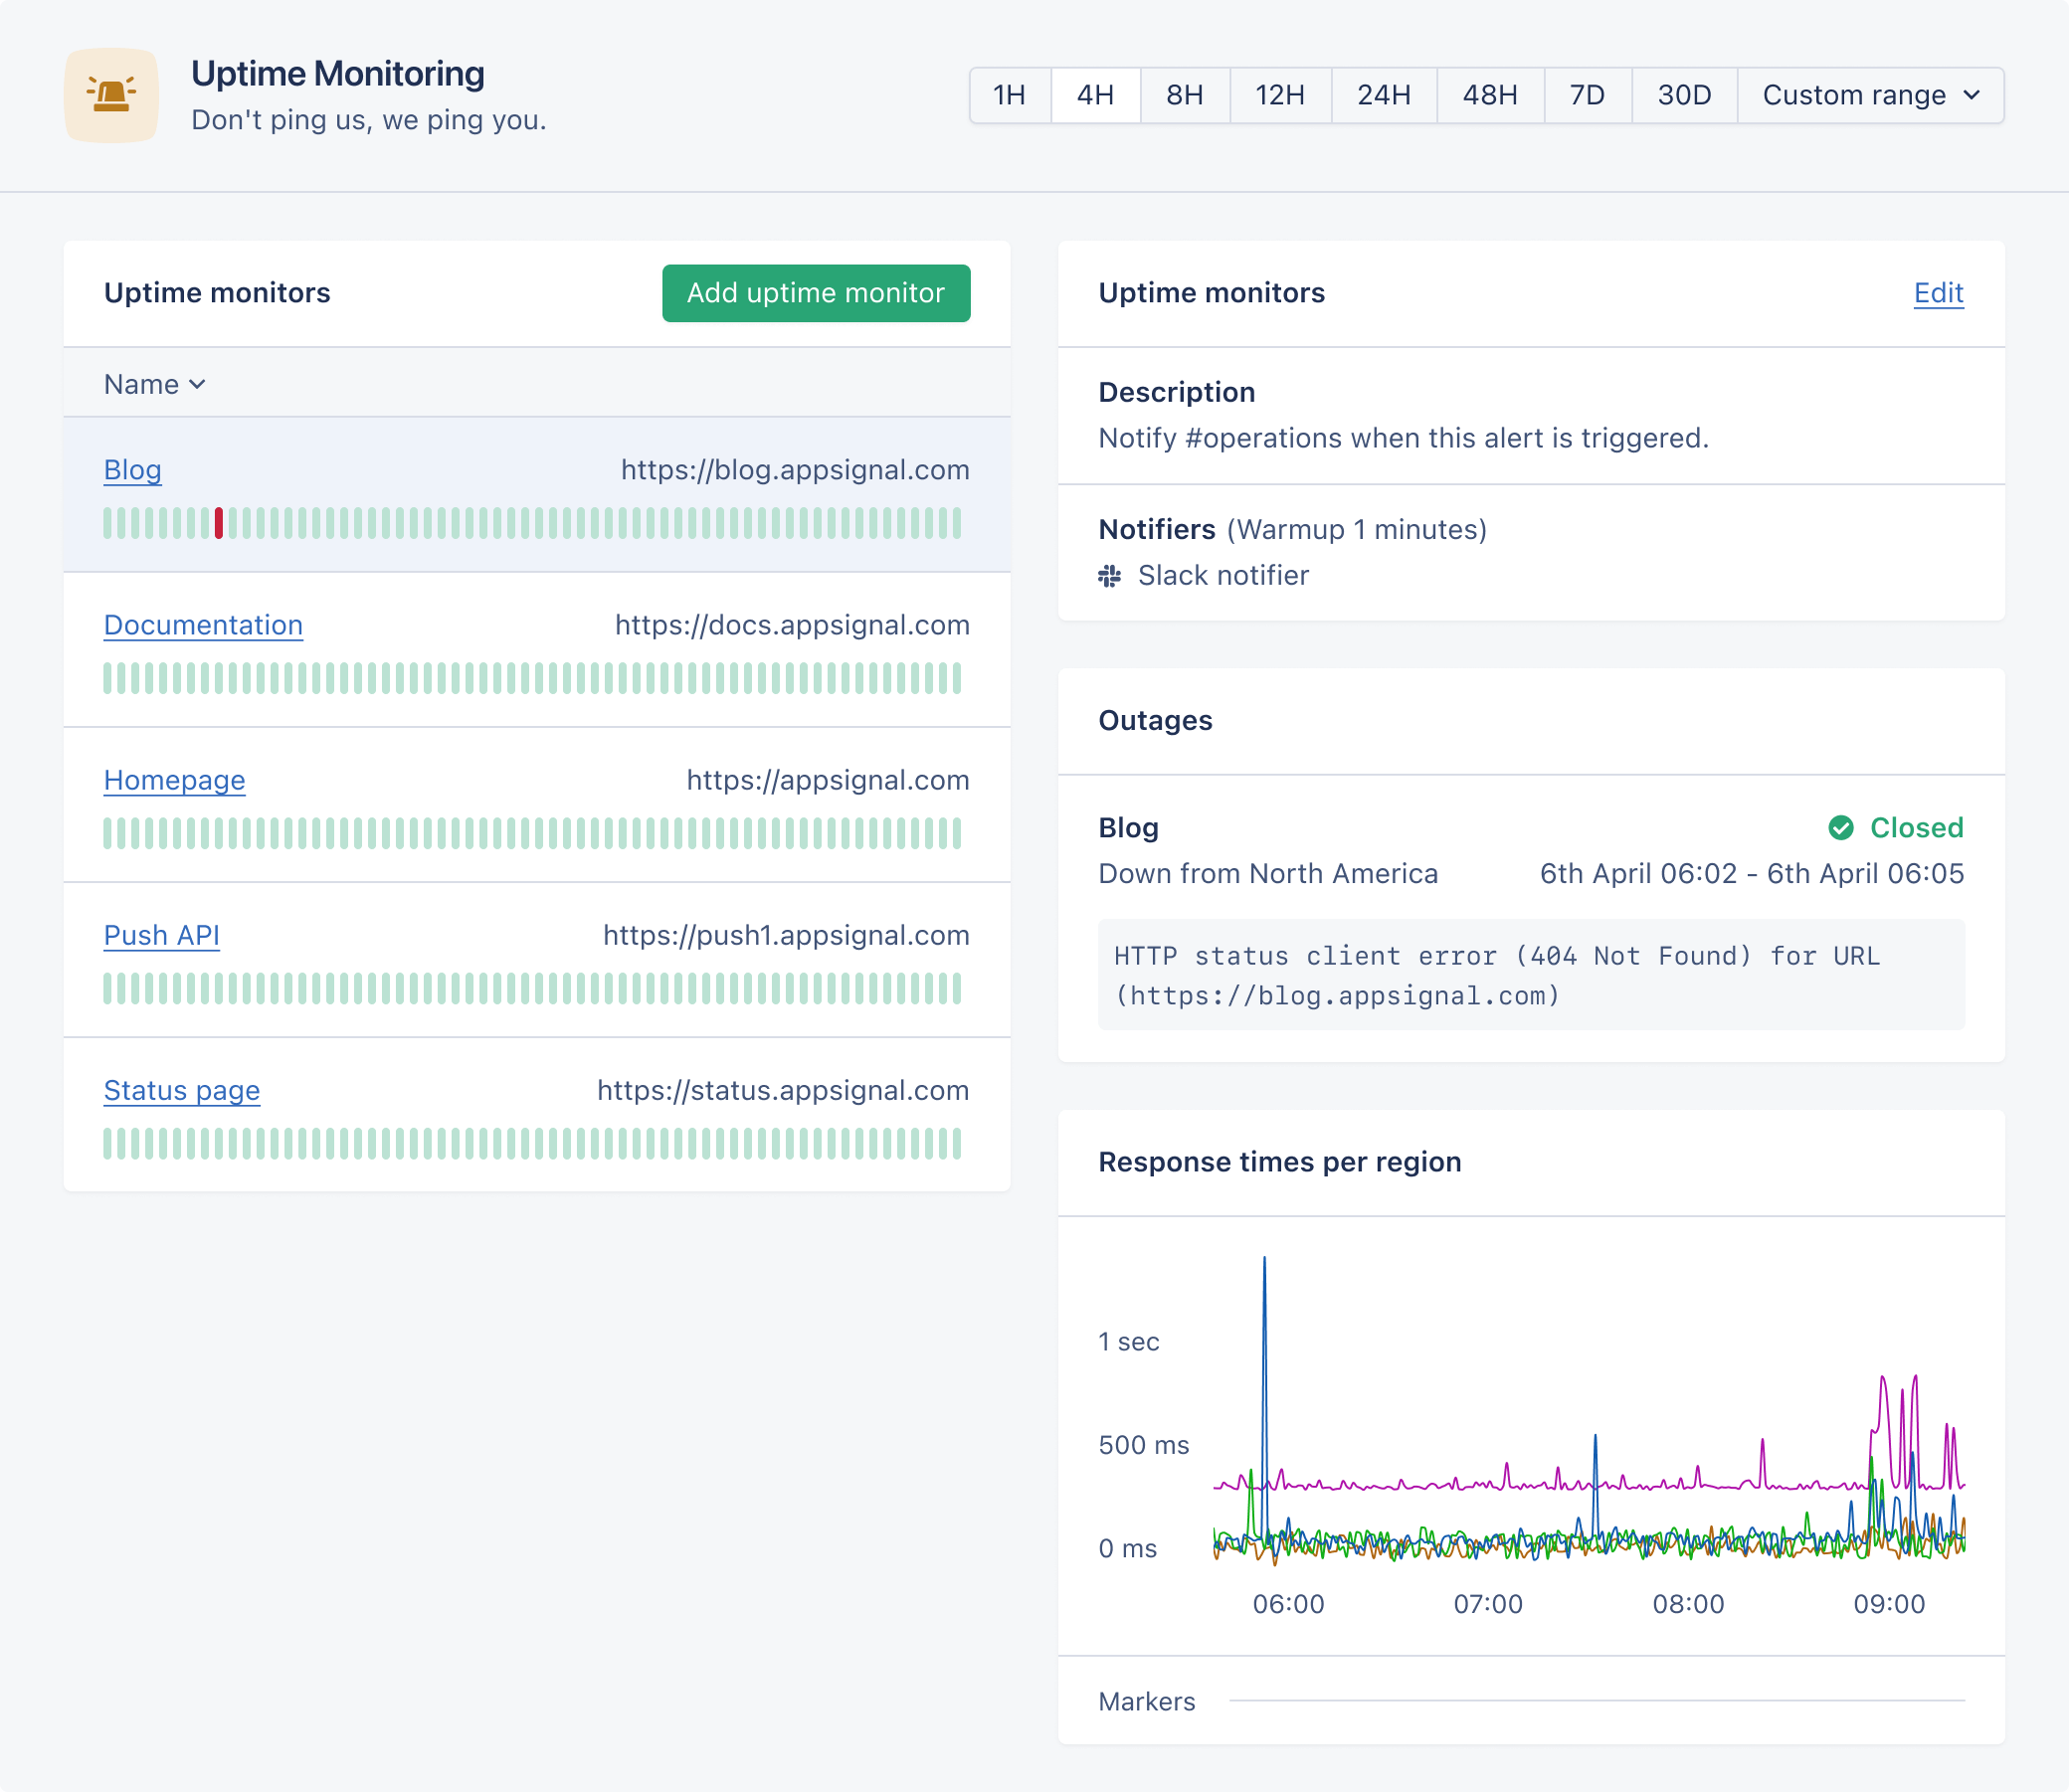
To setup a new uptime monitor check, click the “Add uptime monitor” button on the Uptime Monitoring page. Provide the full URL (includinghttp:// or https://) of the page you’d like to check. Our servers will make a request to this URL every minute from multiple regions and report if the request fails or if the response status code is not in the 2xx range.
In order to receive notifications when your application is down, select a notification method. To prevent receiving alerts on small network hiccups, we recommend setting an alert warm-up period of at least one minute.
You can set headers to be sent in the requests we perform against the URL you provide. This allows you to set authorization headers to enable the requests to go through.
How it works
We ping your applications from AWS Lambda workers that are executed from the following regions: We will request the given URL from the following regions:- Asia-Pacific (Seoul)
- Europe (Frankfurt)
- North America (N. Virginia)
- South America (São Paulo)
User Agent
Our uptime monitoring requests to your application will set theUser-Agent header as follows, where <version> is a version number like 1.0:
Shell
IP Allowlisting
We run our uptime checks on a serverless framework and have no control over what IP address will be used to make the request to your application. Therefore, we’re unable to provide a list of IP addresses to allowlist. The URL to monitor must be publicly reachable from the open internet.Metrics
For every uptime monitor check we create several metrics that you can use to create your own custom graphs and set your own anomaly detection triggers. These metrics will be tagged by the region from which the request was made, and the name of the uptime monitor check. The region tags areasia-pacific, europe, north-america and south-america.
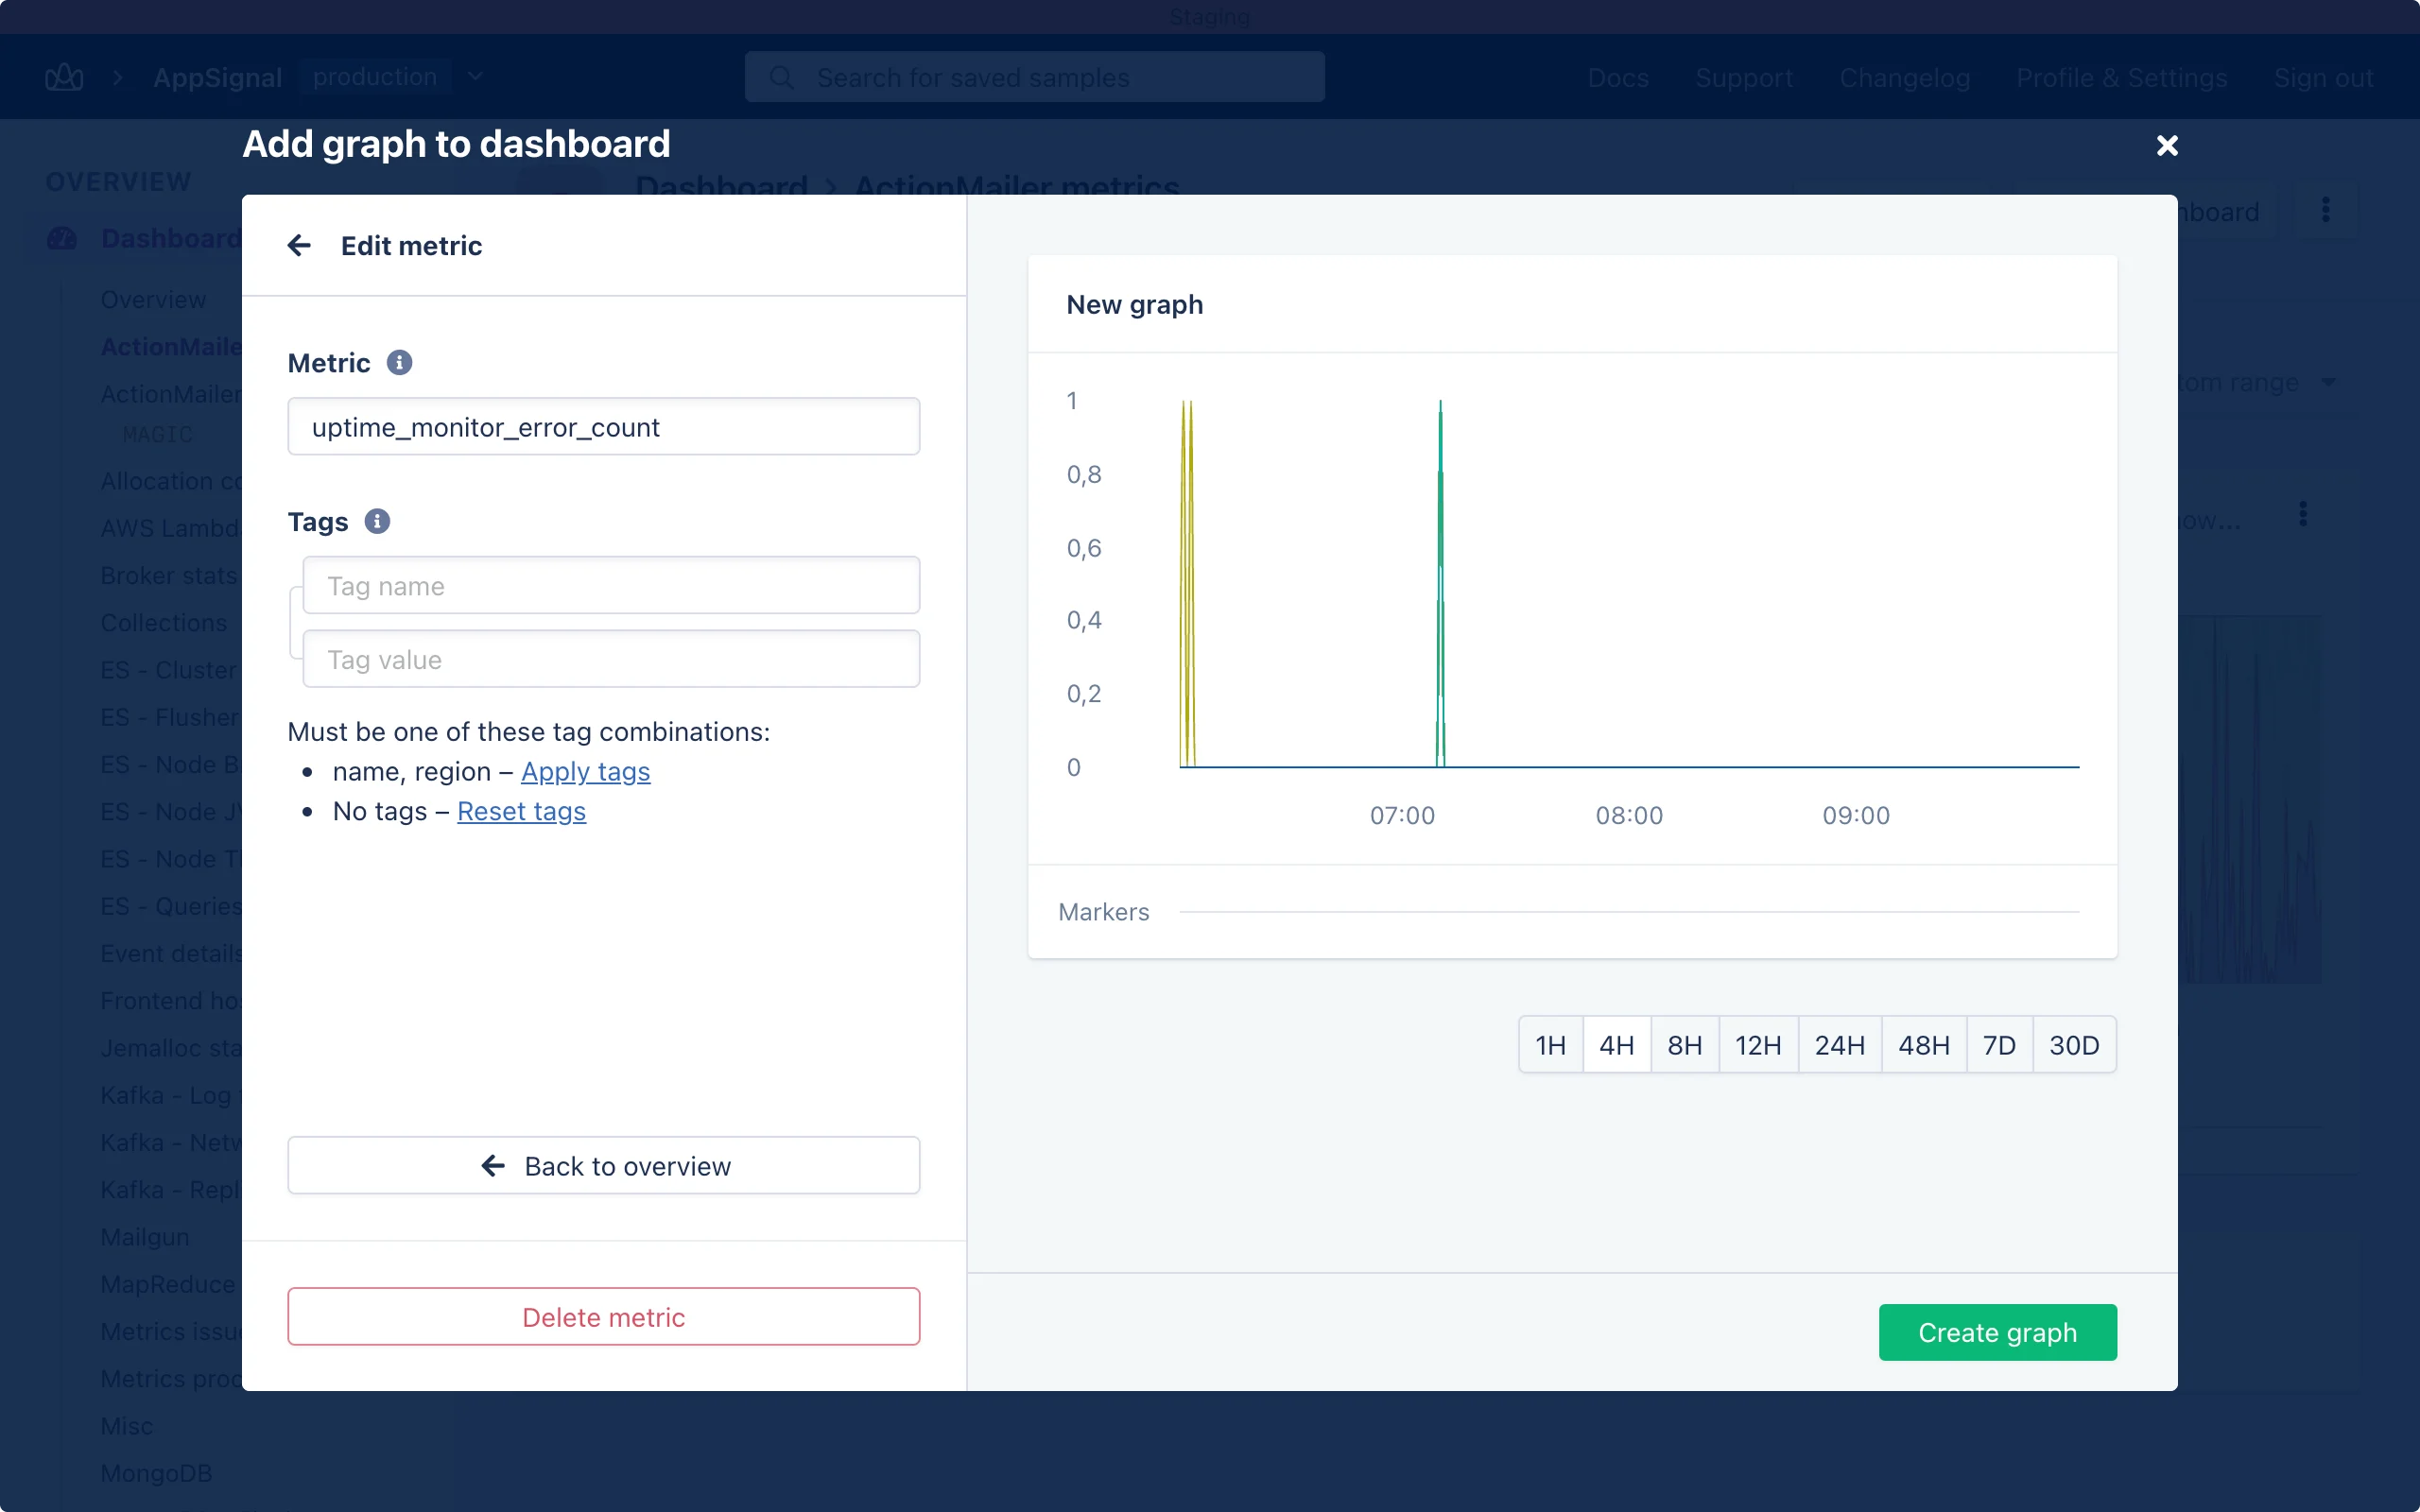
Error count
Theuptime_monitor_error_count metric is a counter that, for a given minute, will be set to zero if the request succeeded or to one if the request fails.
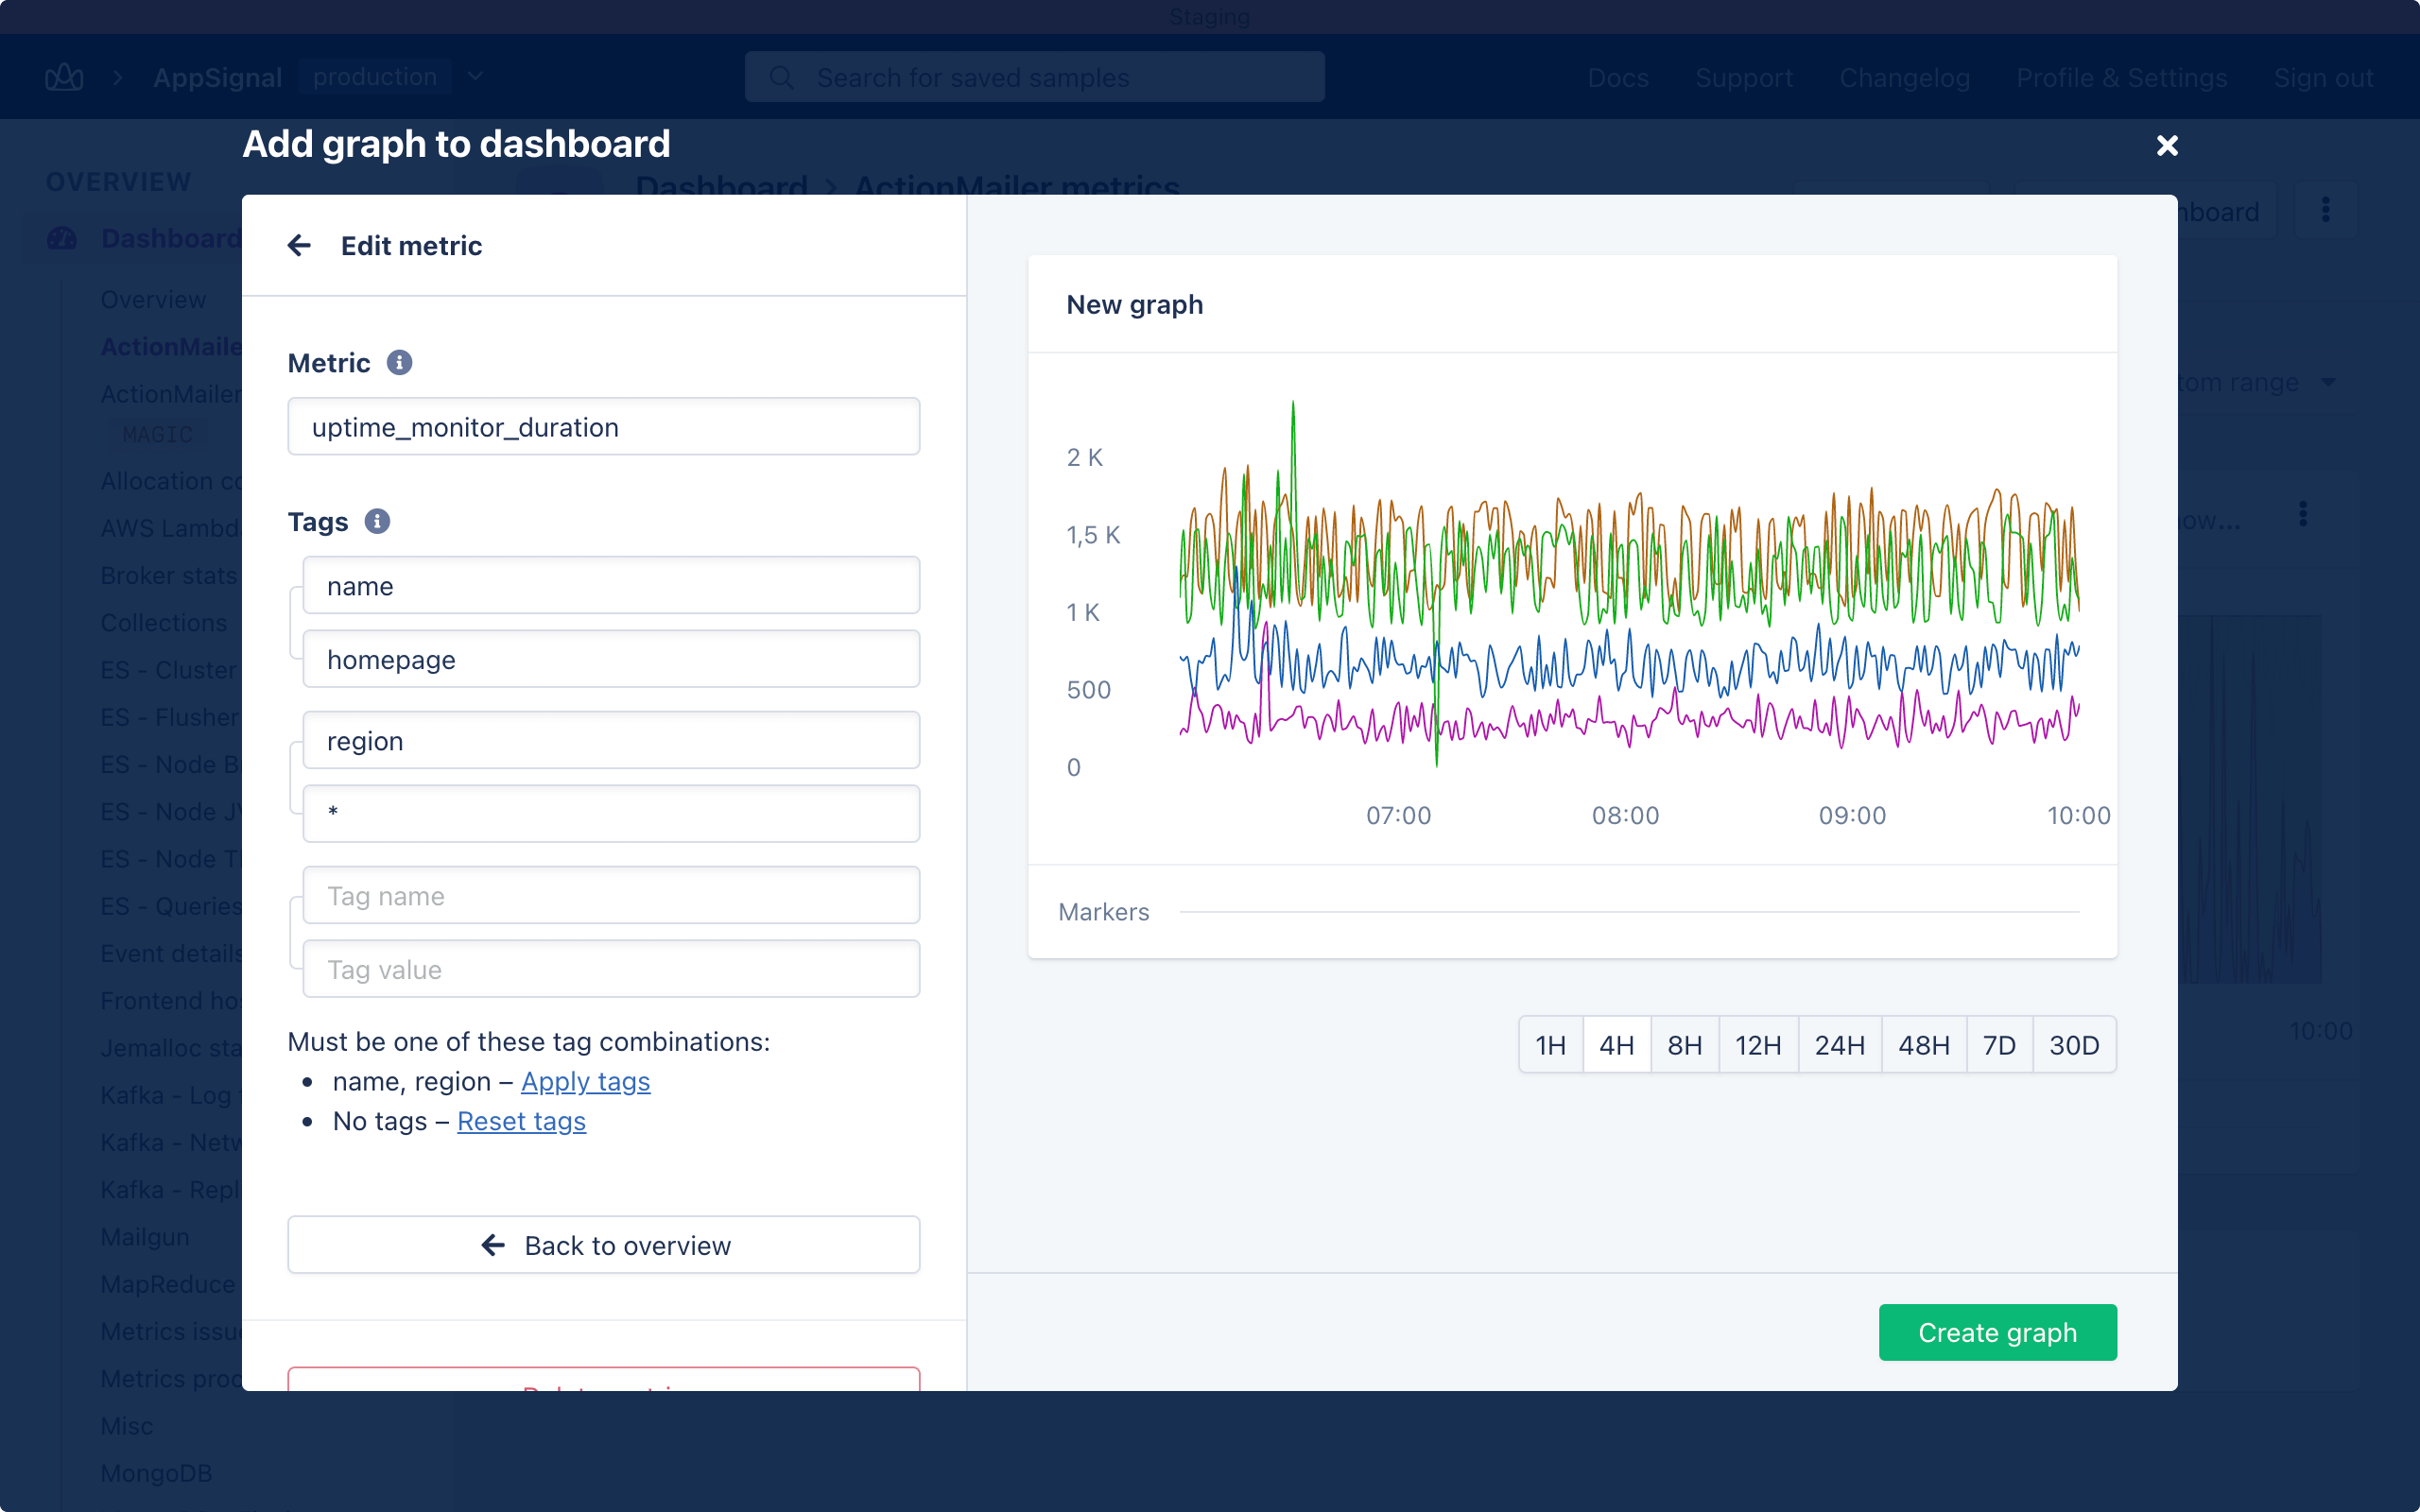
Endpoint performance
Theuptime_monitor_duration metric is a gauge that tracks the duration of the request for each region. This allows you to see if the latency to your servers is increasing.
Plans and Requests
If the application serving the URL uses an AppSignal integration, our uptime monitor can use up a lot of your plan’s monthly requests. We recommend setting up a dedicated health-check endpoint and configuring AppSignal to ignore requests to that endpoint so that they don’t count toward your plan’s limit.Example
Here’s an example of a health-check endpoint in Ruby on Rails. We make sure to hit all our external services, such as the database and Redis, something that might not happen on the homepage, ensuring all services are operational.ignore_actions configuration option: