HTTP dashboard
The HTTP dashboard shows request volume and latency for Render web services. Render aggregates these metrics across all instances of a service, so each line corresponds to a host and status code combination across the whole service rather than a specific replica. HTTP requests: Number of HTTP requests received, broken down by host and status code. It uses the following metric:render.service.http.requests.total.
HTTP latency: Response latency at the p50, p95 and p99 percentiles, broken down by host and status code. It uses the following metric: render.service.http.requests.latency.
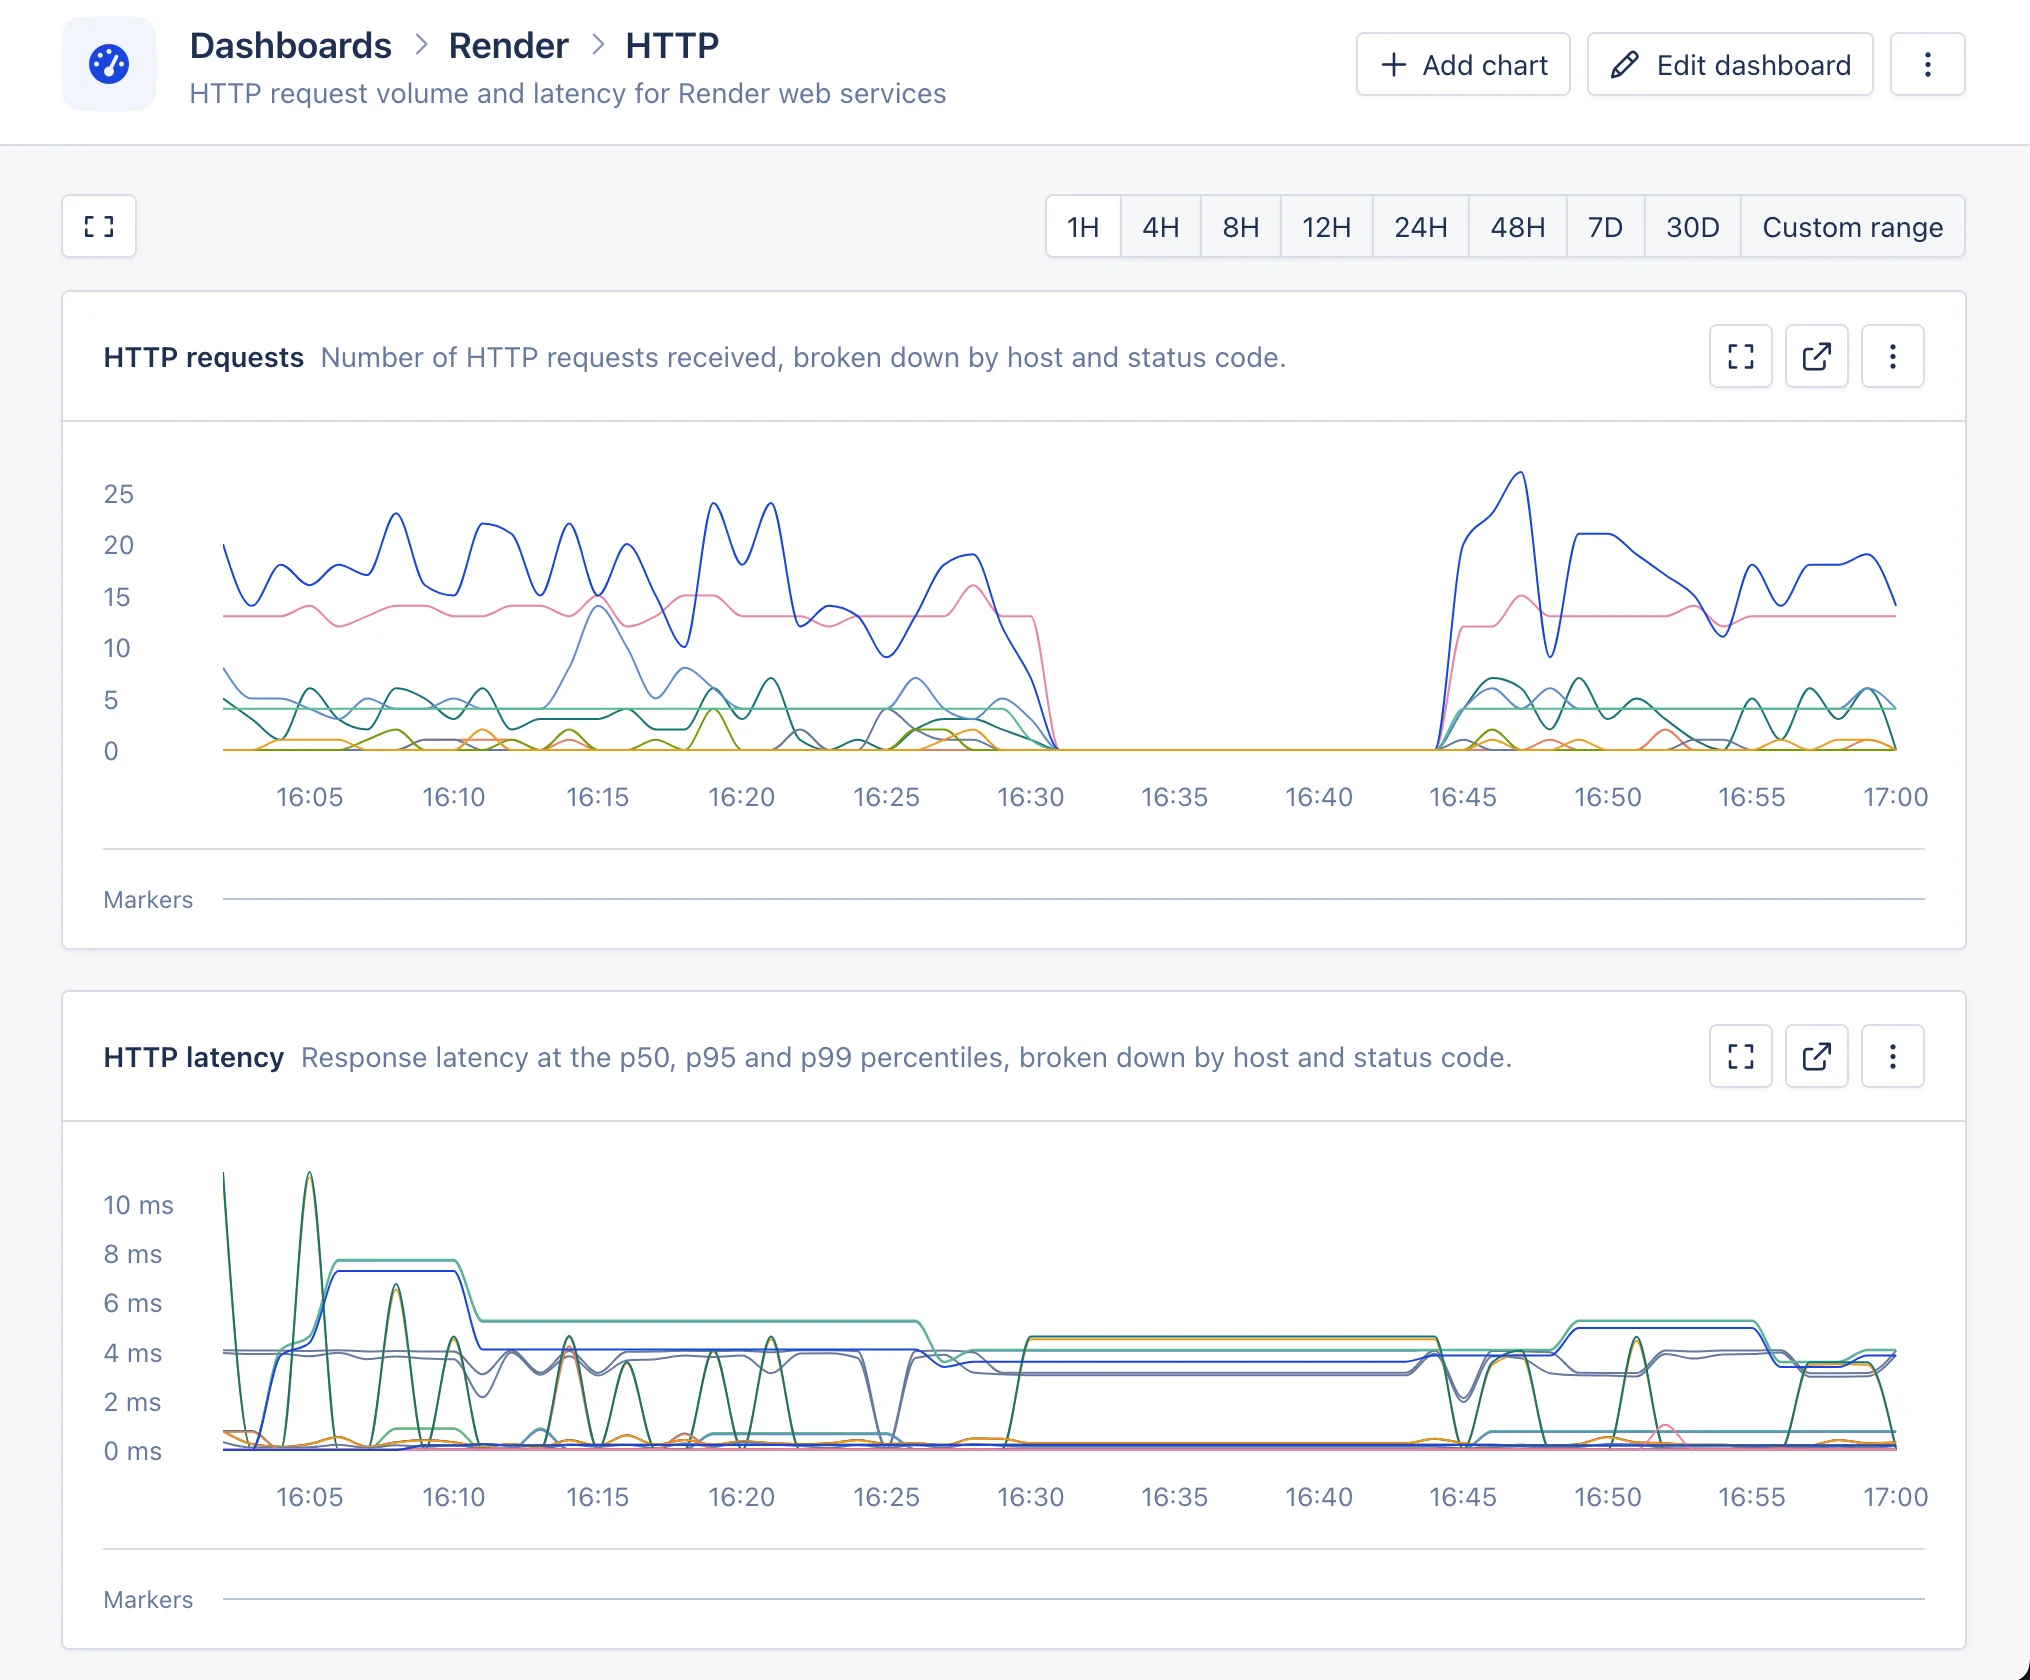
The automated Render HTTP dashboard in AppSignal.
Postgres dashboard
The Postgres dashboard shows information about Render Postgres instances connected to your workspace. Connections: Active connections per database, compared against the connection limit. It uses the following metrics:render.postgres.connections and render.postgres.connection.limit.
Storage size: Database size and indexes size per database. It uses the following metrics: render.postgres.database.size and render.postgres.indexes.size.
Transaction volume: Number of transactions over time. It uses the following metric: render.postgres.transaction.volume.
Sequential table scans: Sequential scans per database. A high number of sequential scans can indicate missing indexes. It uses the following metric: render.postgres.table.scans.
Transaction exhaustion: Per-database transaction ID exhaustion, useful for monitoring vacuuming health. It uses the following metric: render.postgres.transaction.exhaustion.
Slow locks: Number of locks that exceeded the slow threshold. It uses the following metric: render.postgres.slow.lock.count.
Slow lock wait time: Time spent waiting on slow locks. It uses the following metric: render.postgres.slow.lock.time.
Replication lag: Replication delay per replica host. It uses the following metrics: render.postgres.replication.lag and render.postgres.replication.apply.lag.
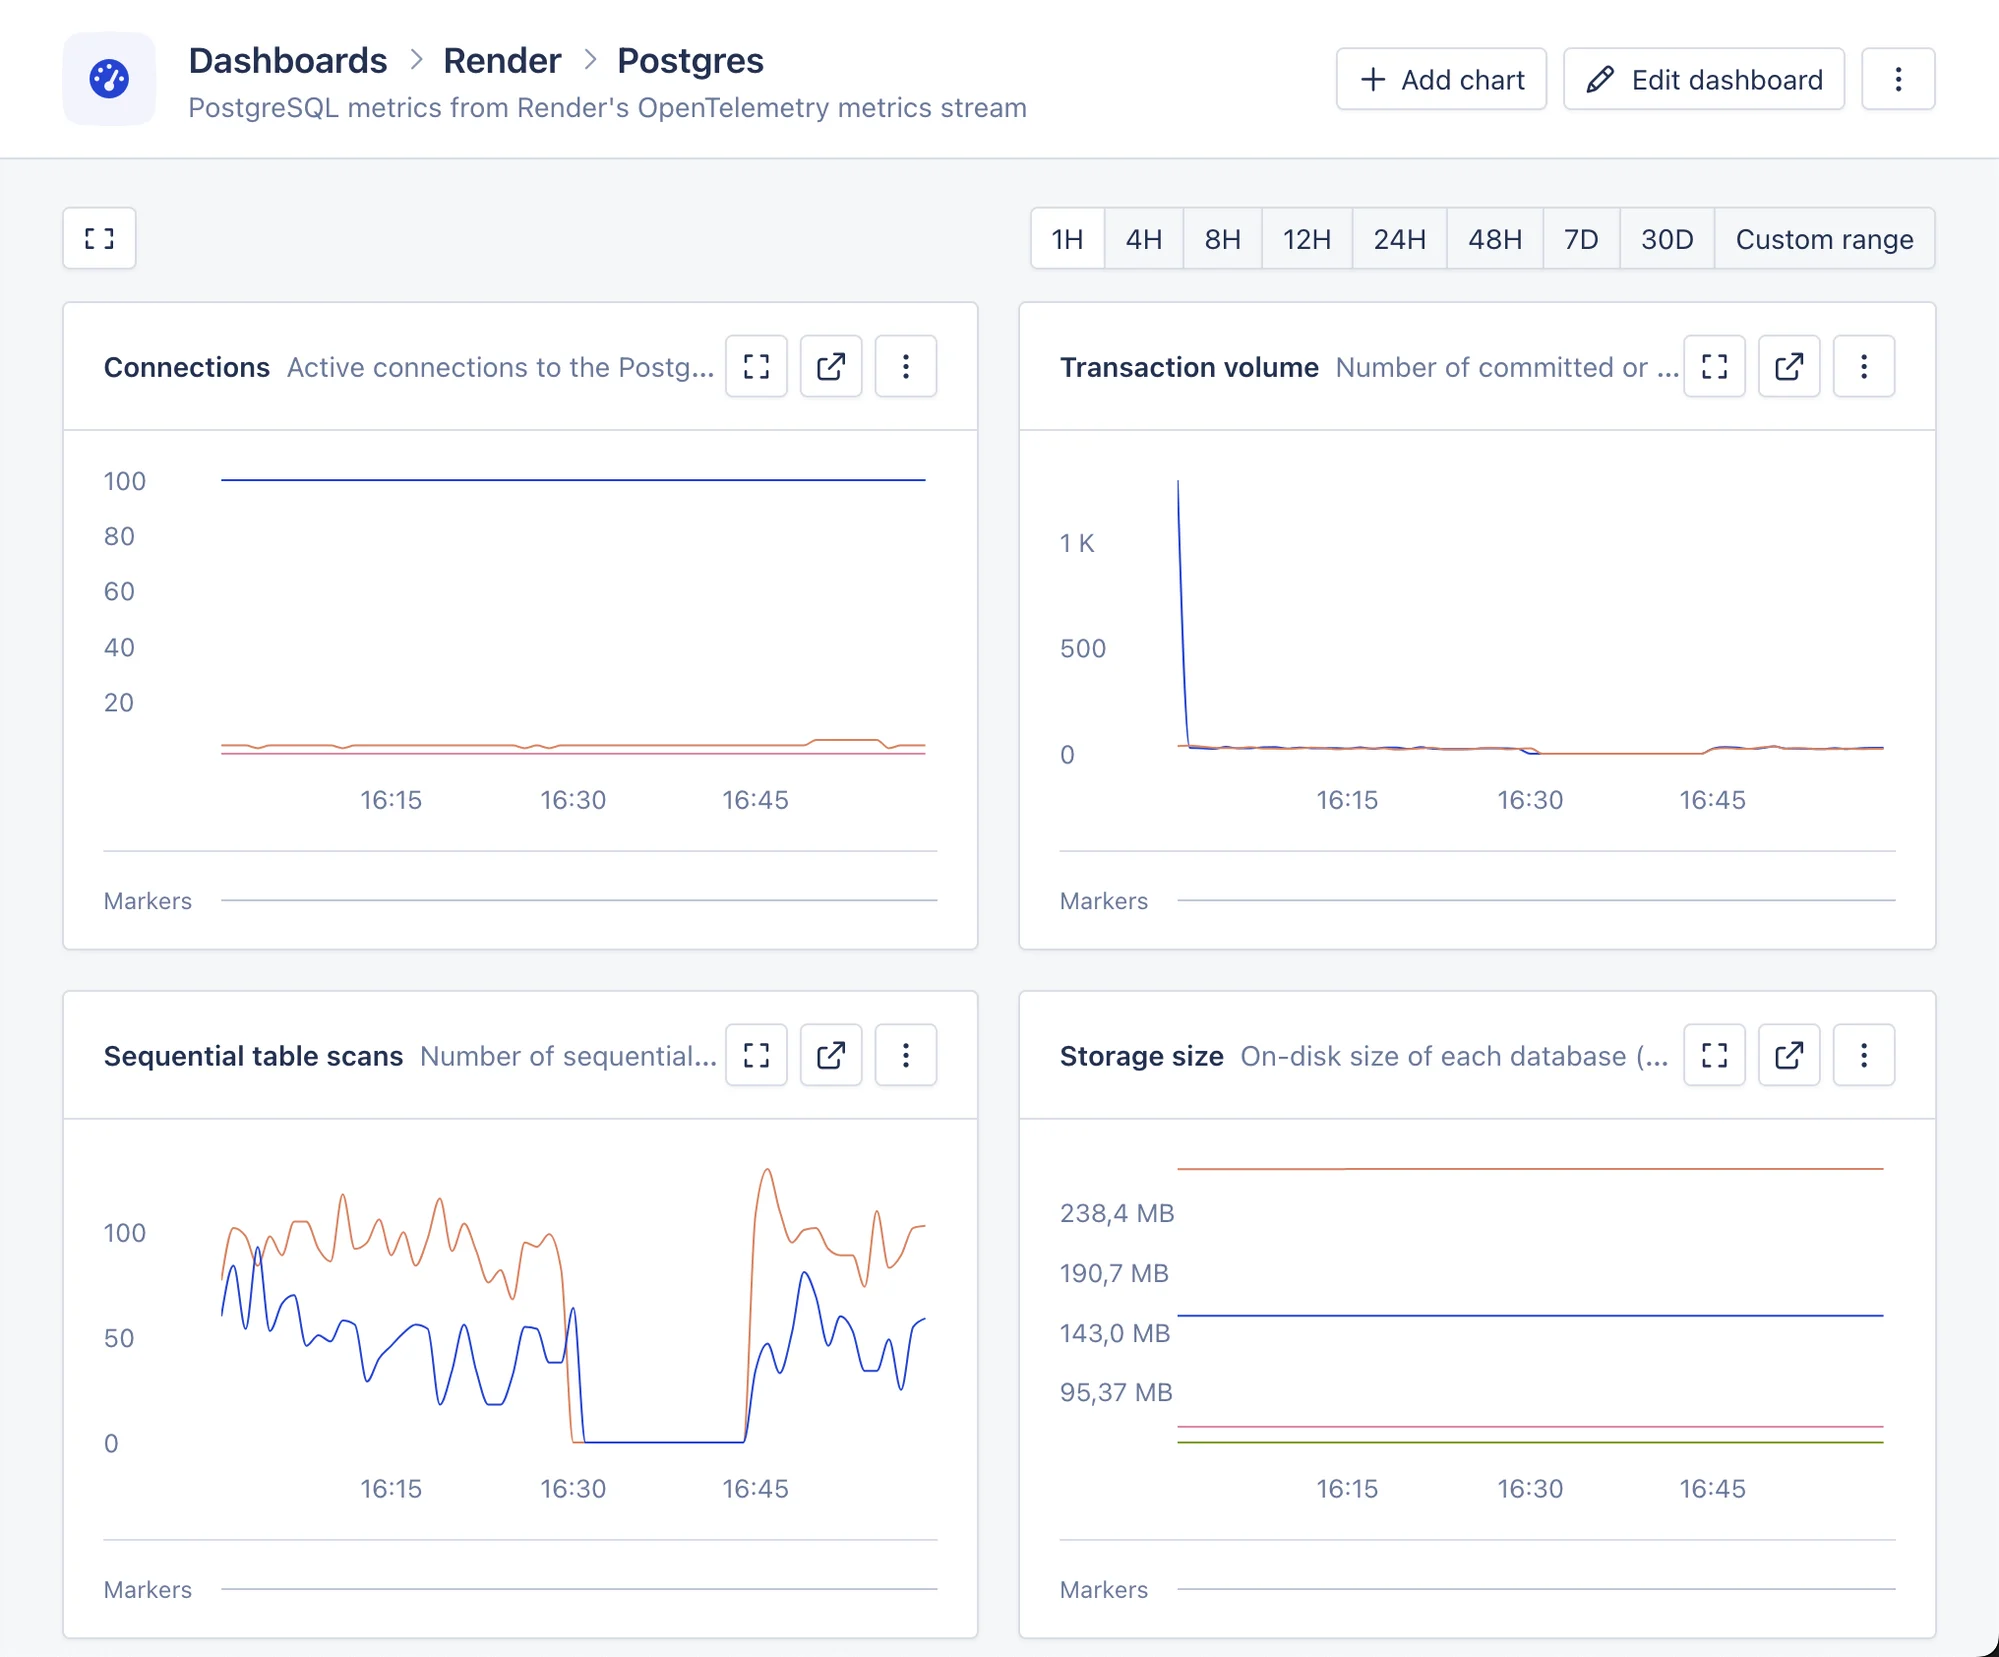
The automated Render Postgres dashboard in AppSignal.
Key Value dashboard
The Key Value dashboard shows connection metrics for Render Key Value (Valkey/Redis) services. Connections: Active connections, compared against the connection limit. It uses the following metrics:render.keyvalue.connections and render.keyvalue.connection.limit.
CPU, memory, disk and network usage for Key Value services are reported as host metrics and appear in the “host metrics” section instead of on this dashboard.
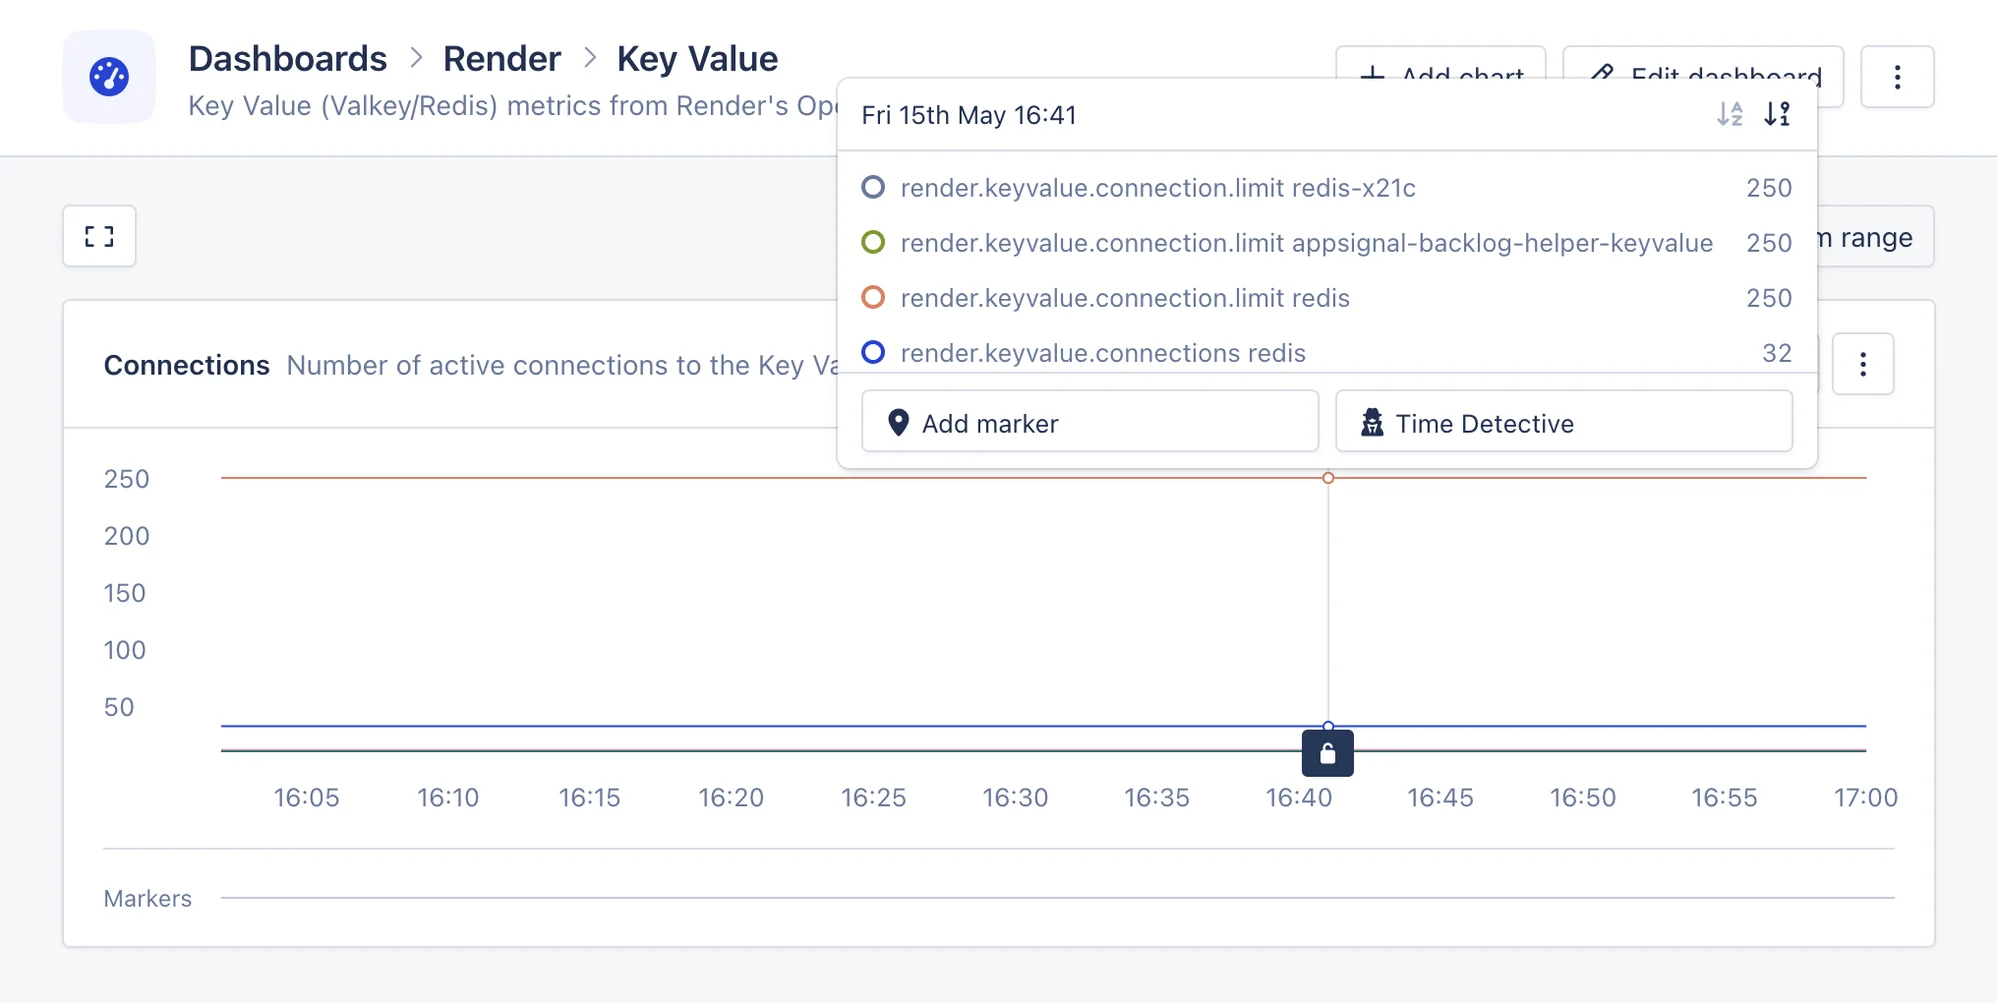
The automated Render Key Value dashboard in AppSignal.