Configuration
To send MongoDB data to AppSignal using Vector, you will need to configure the MongoDB source and AppSignal sink in your Vector configuration. We’ll be using the TOML configuration file as an example.- Add a new source of the
mongodb_metricssource type to your configuration file. The name of the source is the part following the dot insources.mongodb, not themongodb_metricstype.
- Configure the source’s
endpointsoption with the MongoDB URL for your database. Replace the variables ($VARIABLE_NAME) with the values for your database, or pass them as environment variables. If running a database cluster, you should specify each member of the cluster as an endpoint.
- Update
inputsin theappsignalsink to include the name of themongodb_metricssource:
vector.toml configuration file. Your Vector configuration method may be different.
Dashboards
From your MongoDB instances’ metrics, we’ll automatically set up several dashboards.Status dashboard
The Status dashboard focuses on the overall health and activity of your MongoDB instances.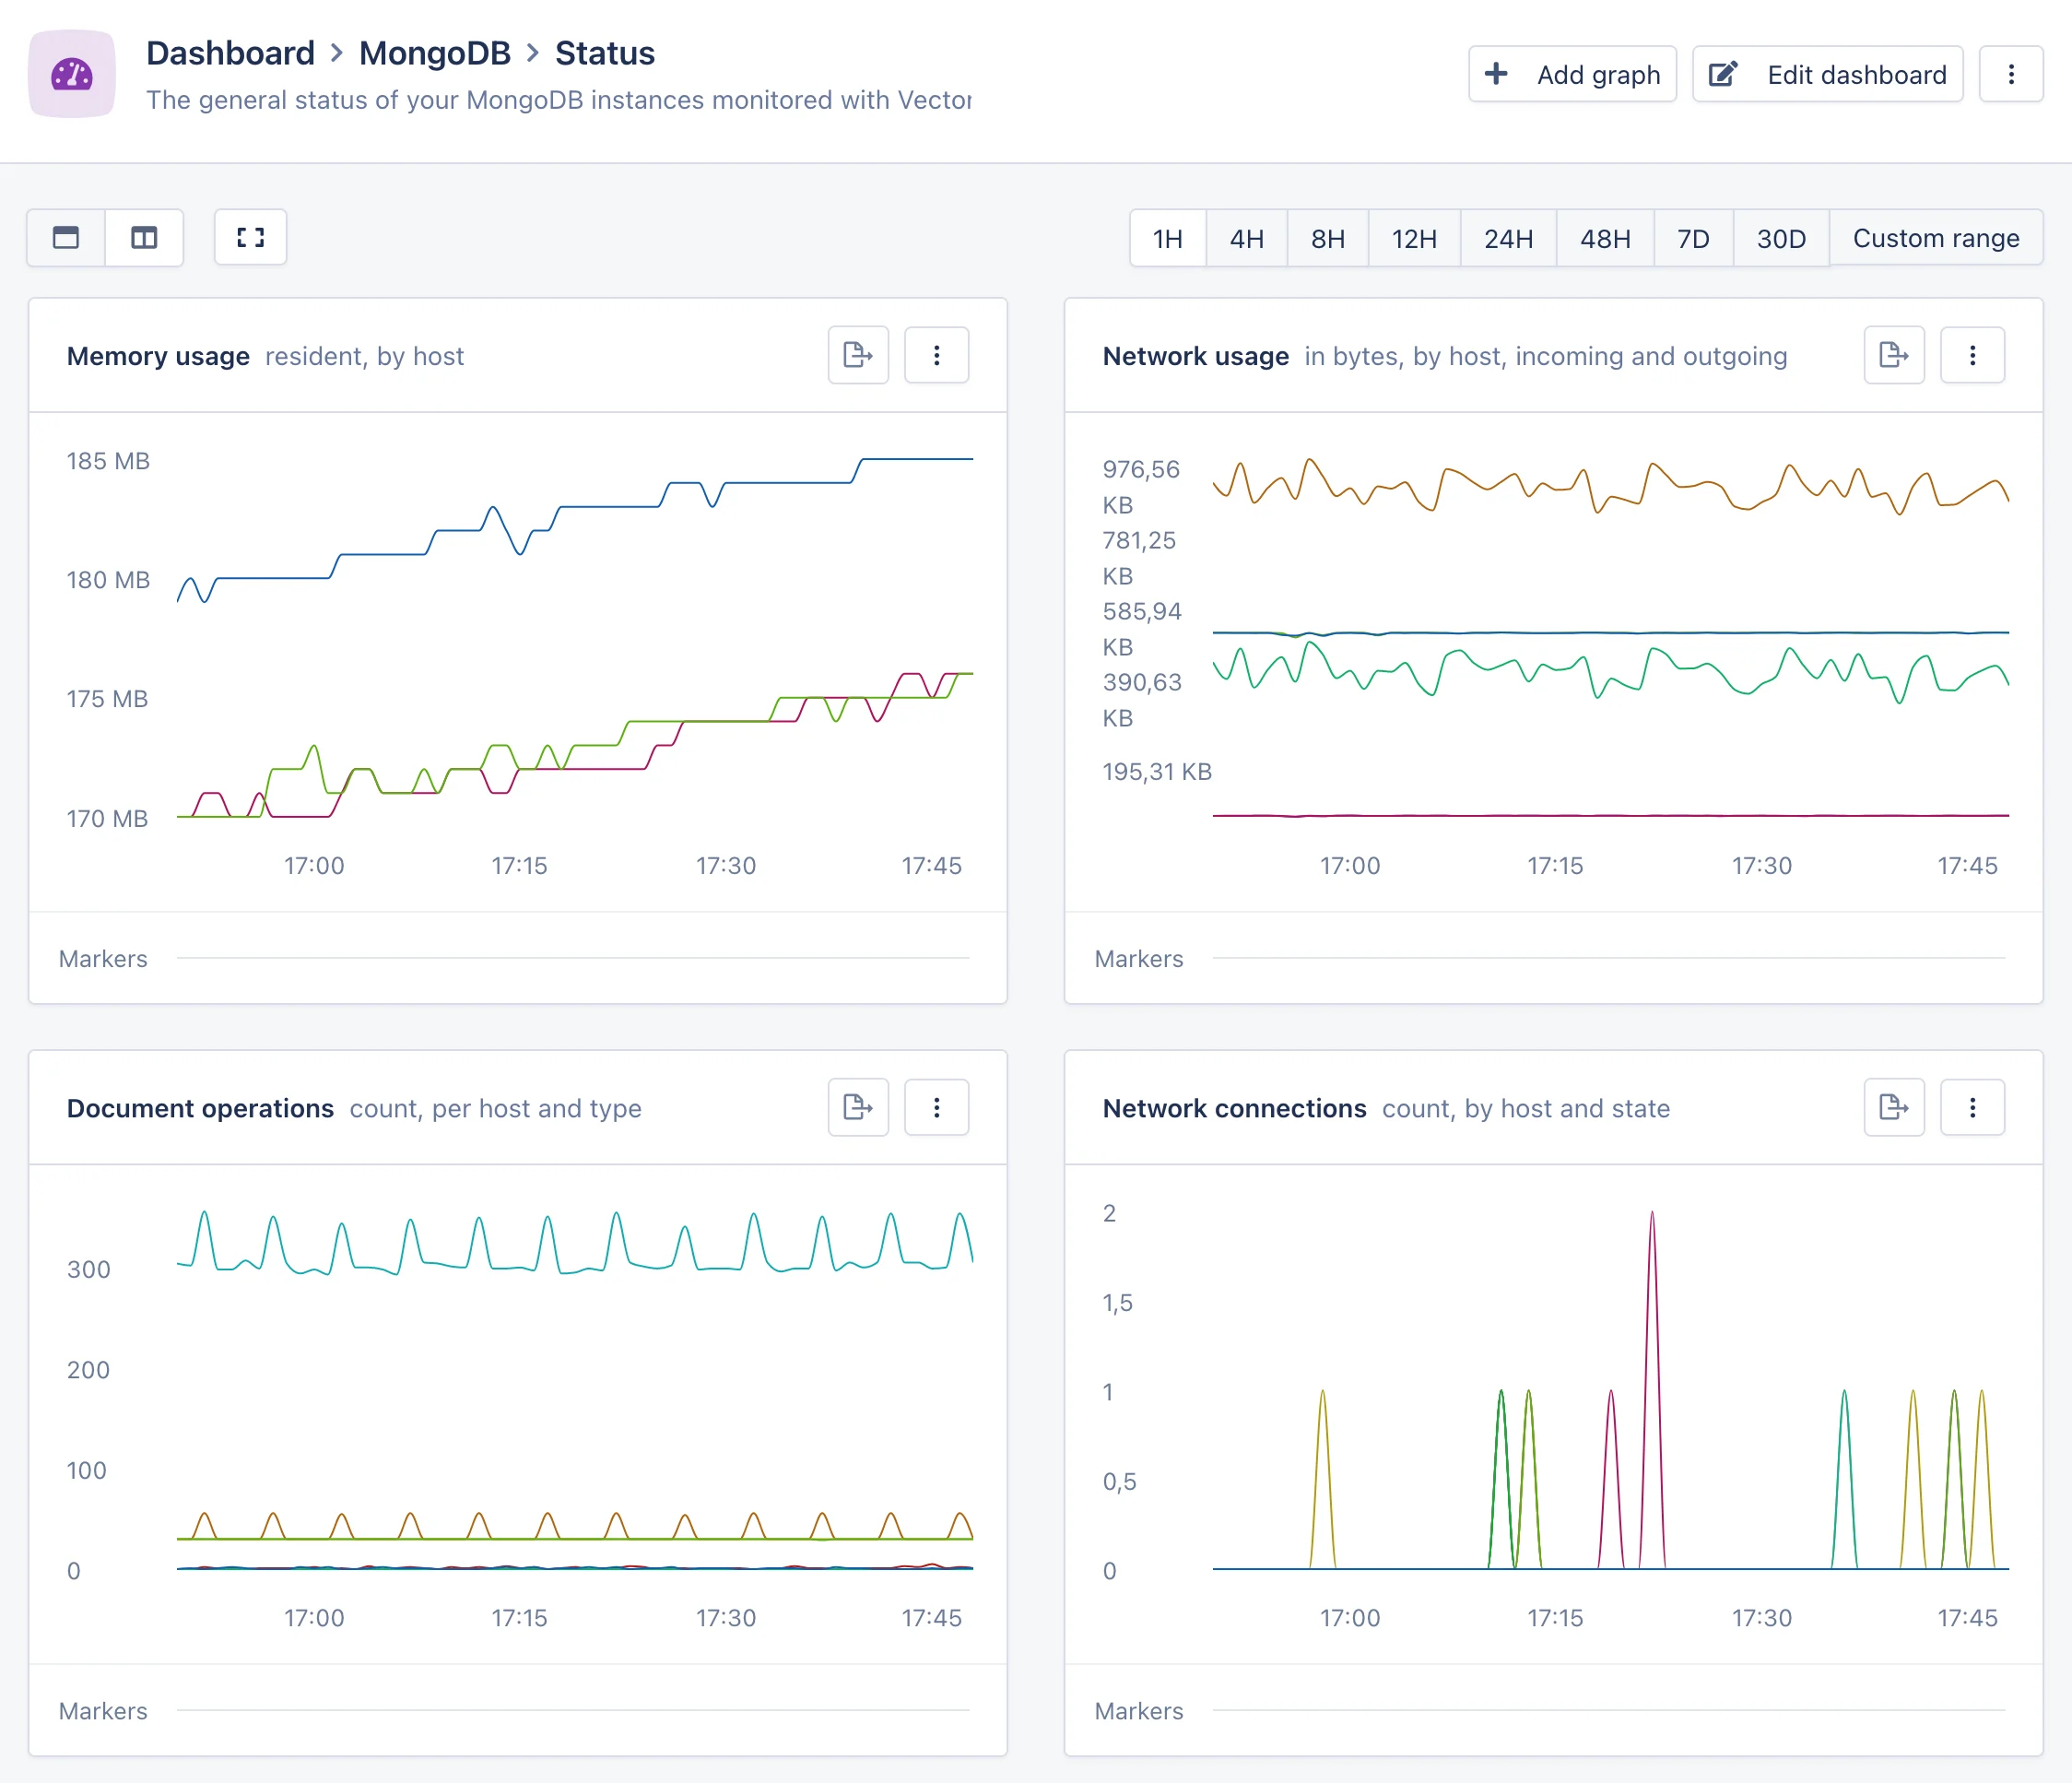
WiredTiger dashboard
The WiredTiger dashboard provides an in-depth view into the internals of the MongoDB database engine.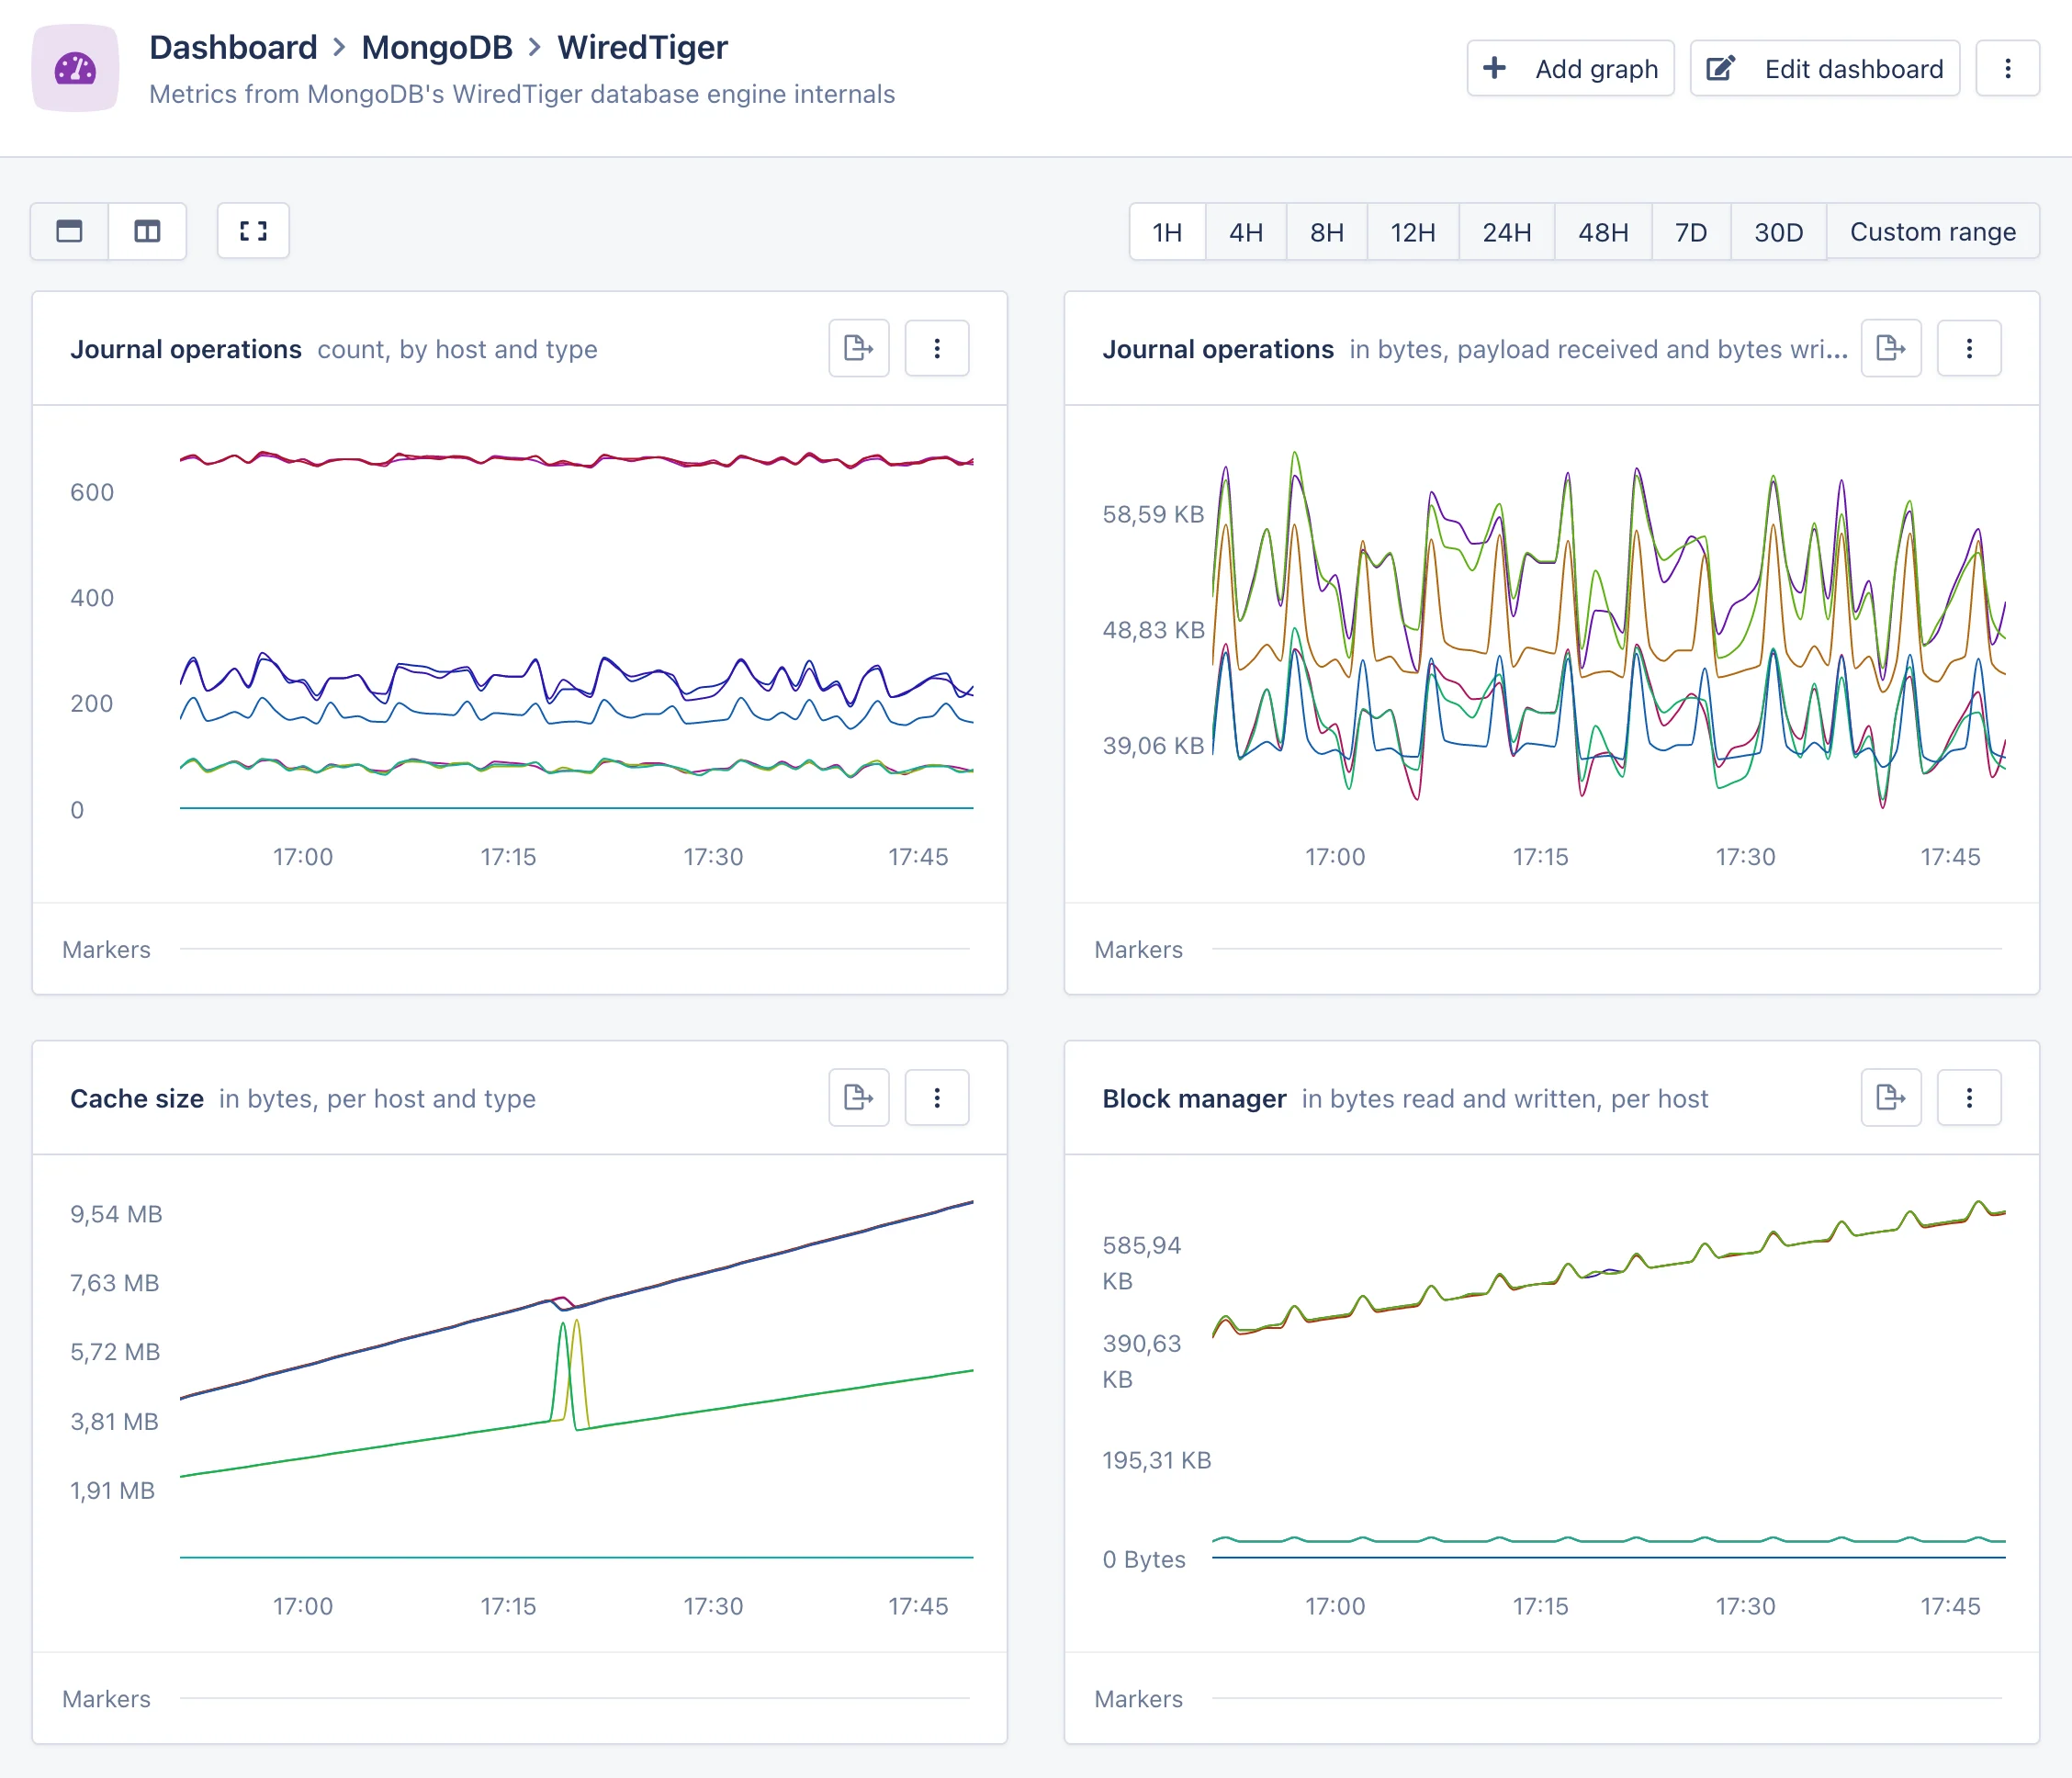
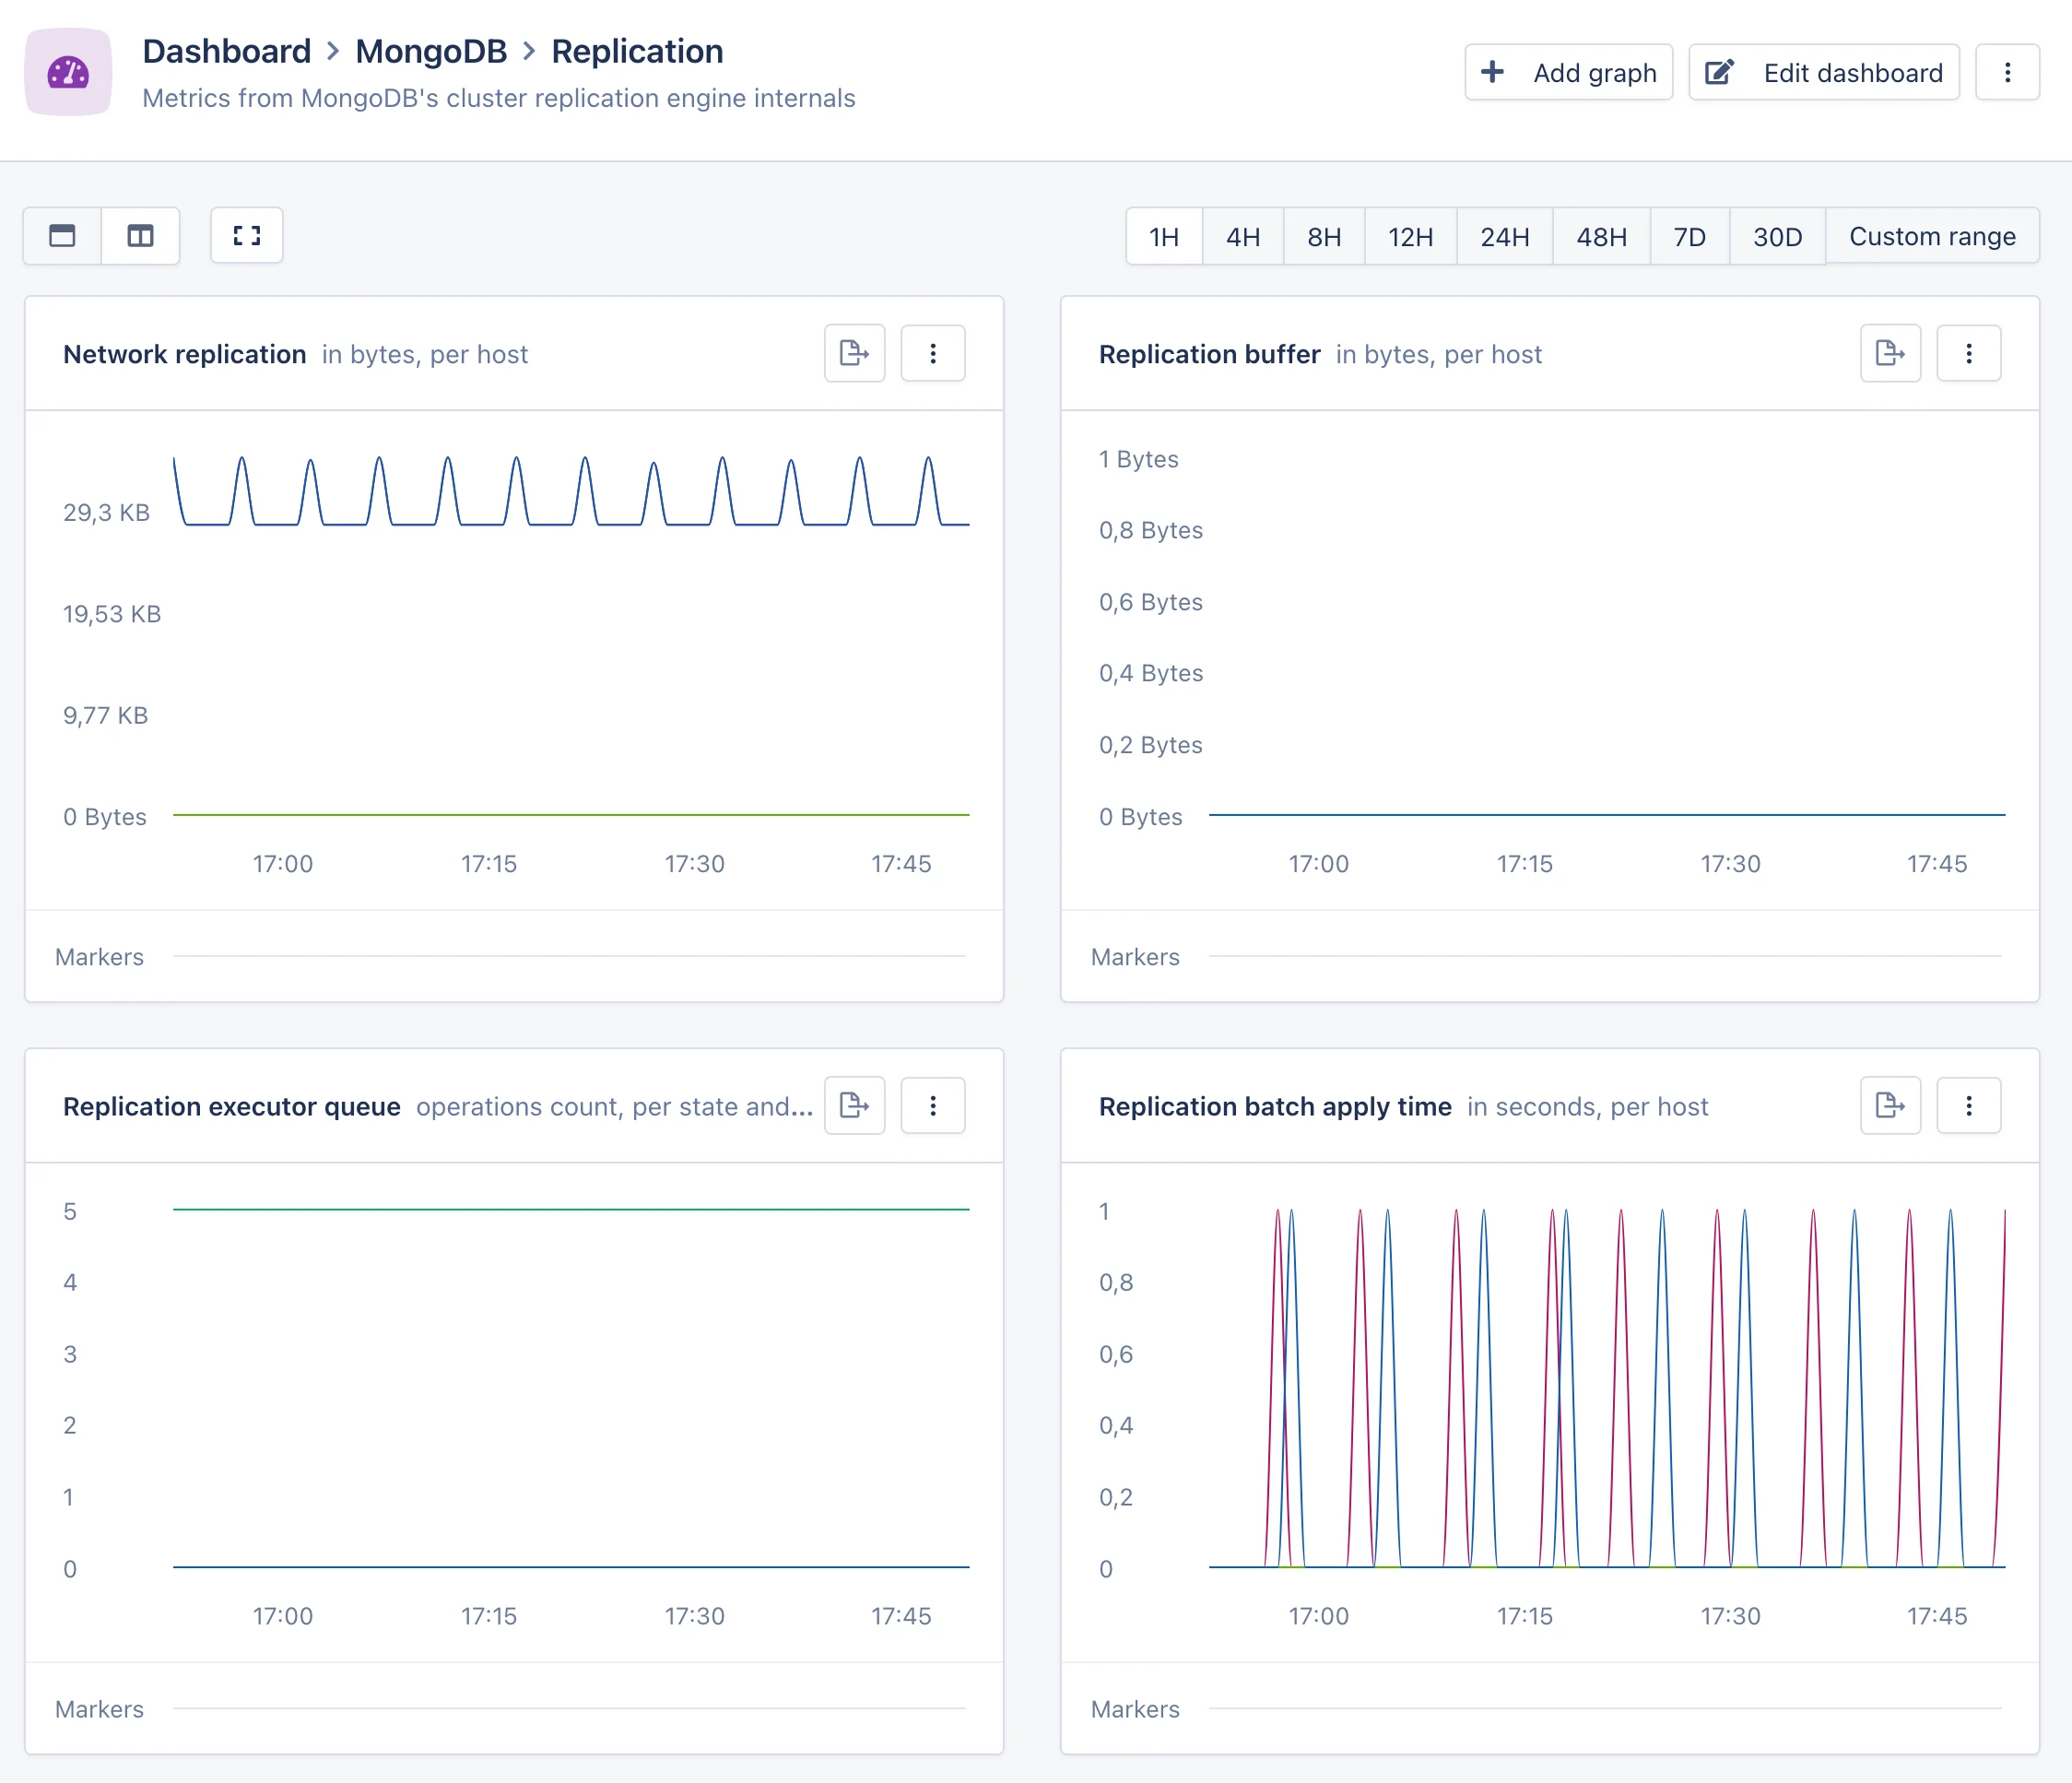
Replication dashboard
The Replication dashboard provides a view into the internals of the MongoDB cluster replication system. This dashboard will only appear if you are running a MongoDB cluster.