Queue times
A common setup for Ruby application is that the Ruby webserver such as Unicorn or Puma runs behind another (outer) webserver such as Nginx or Apache. Those are usually used to terminate SSL connections and handle static assets for example. When your Ruby webserver is busy processing requests, Nginx or Apache can still accept new connections and wait for a Ruby process to become available to handle the request. The outer webserver queue’s the request in the meantime. Ideally there is enough capacity that the outer webserver never has to wait on Ruby, but in practice this can happen when there’s a sudden spike of requests. A good indicator of capacity therefore is the queue time metric, e.g. the amount of time between when the outer webserver accepted the request and Ruby handles the request. A long queue time for a longer period of time indicates that you’ll need to scale up the amount of Ruby processes/threads to handle requests, or scale more webservers. You can find the queue time metrics on the Performance graphs page: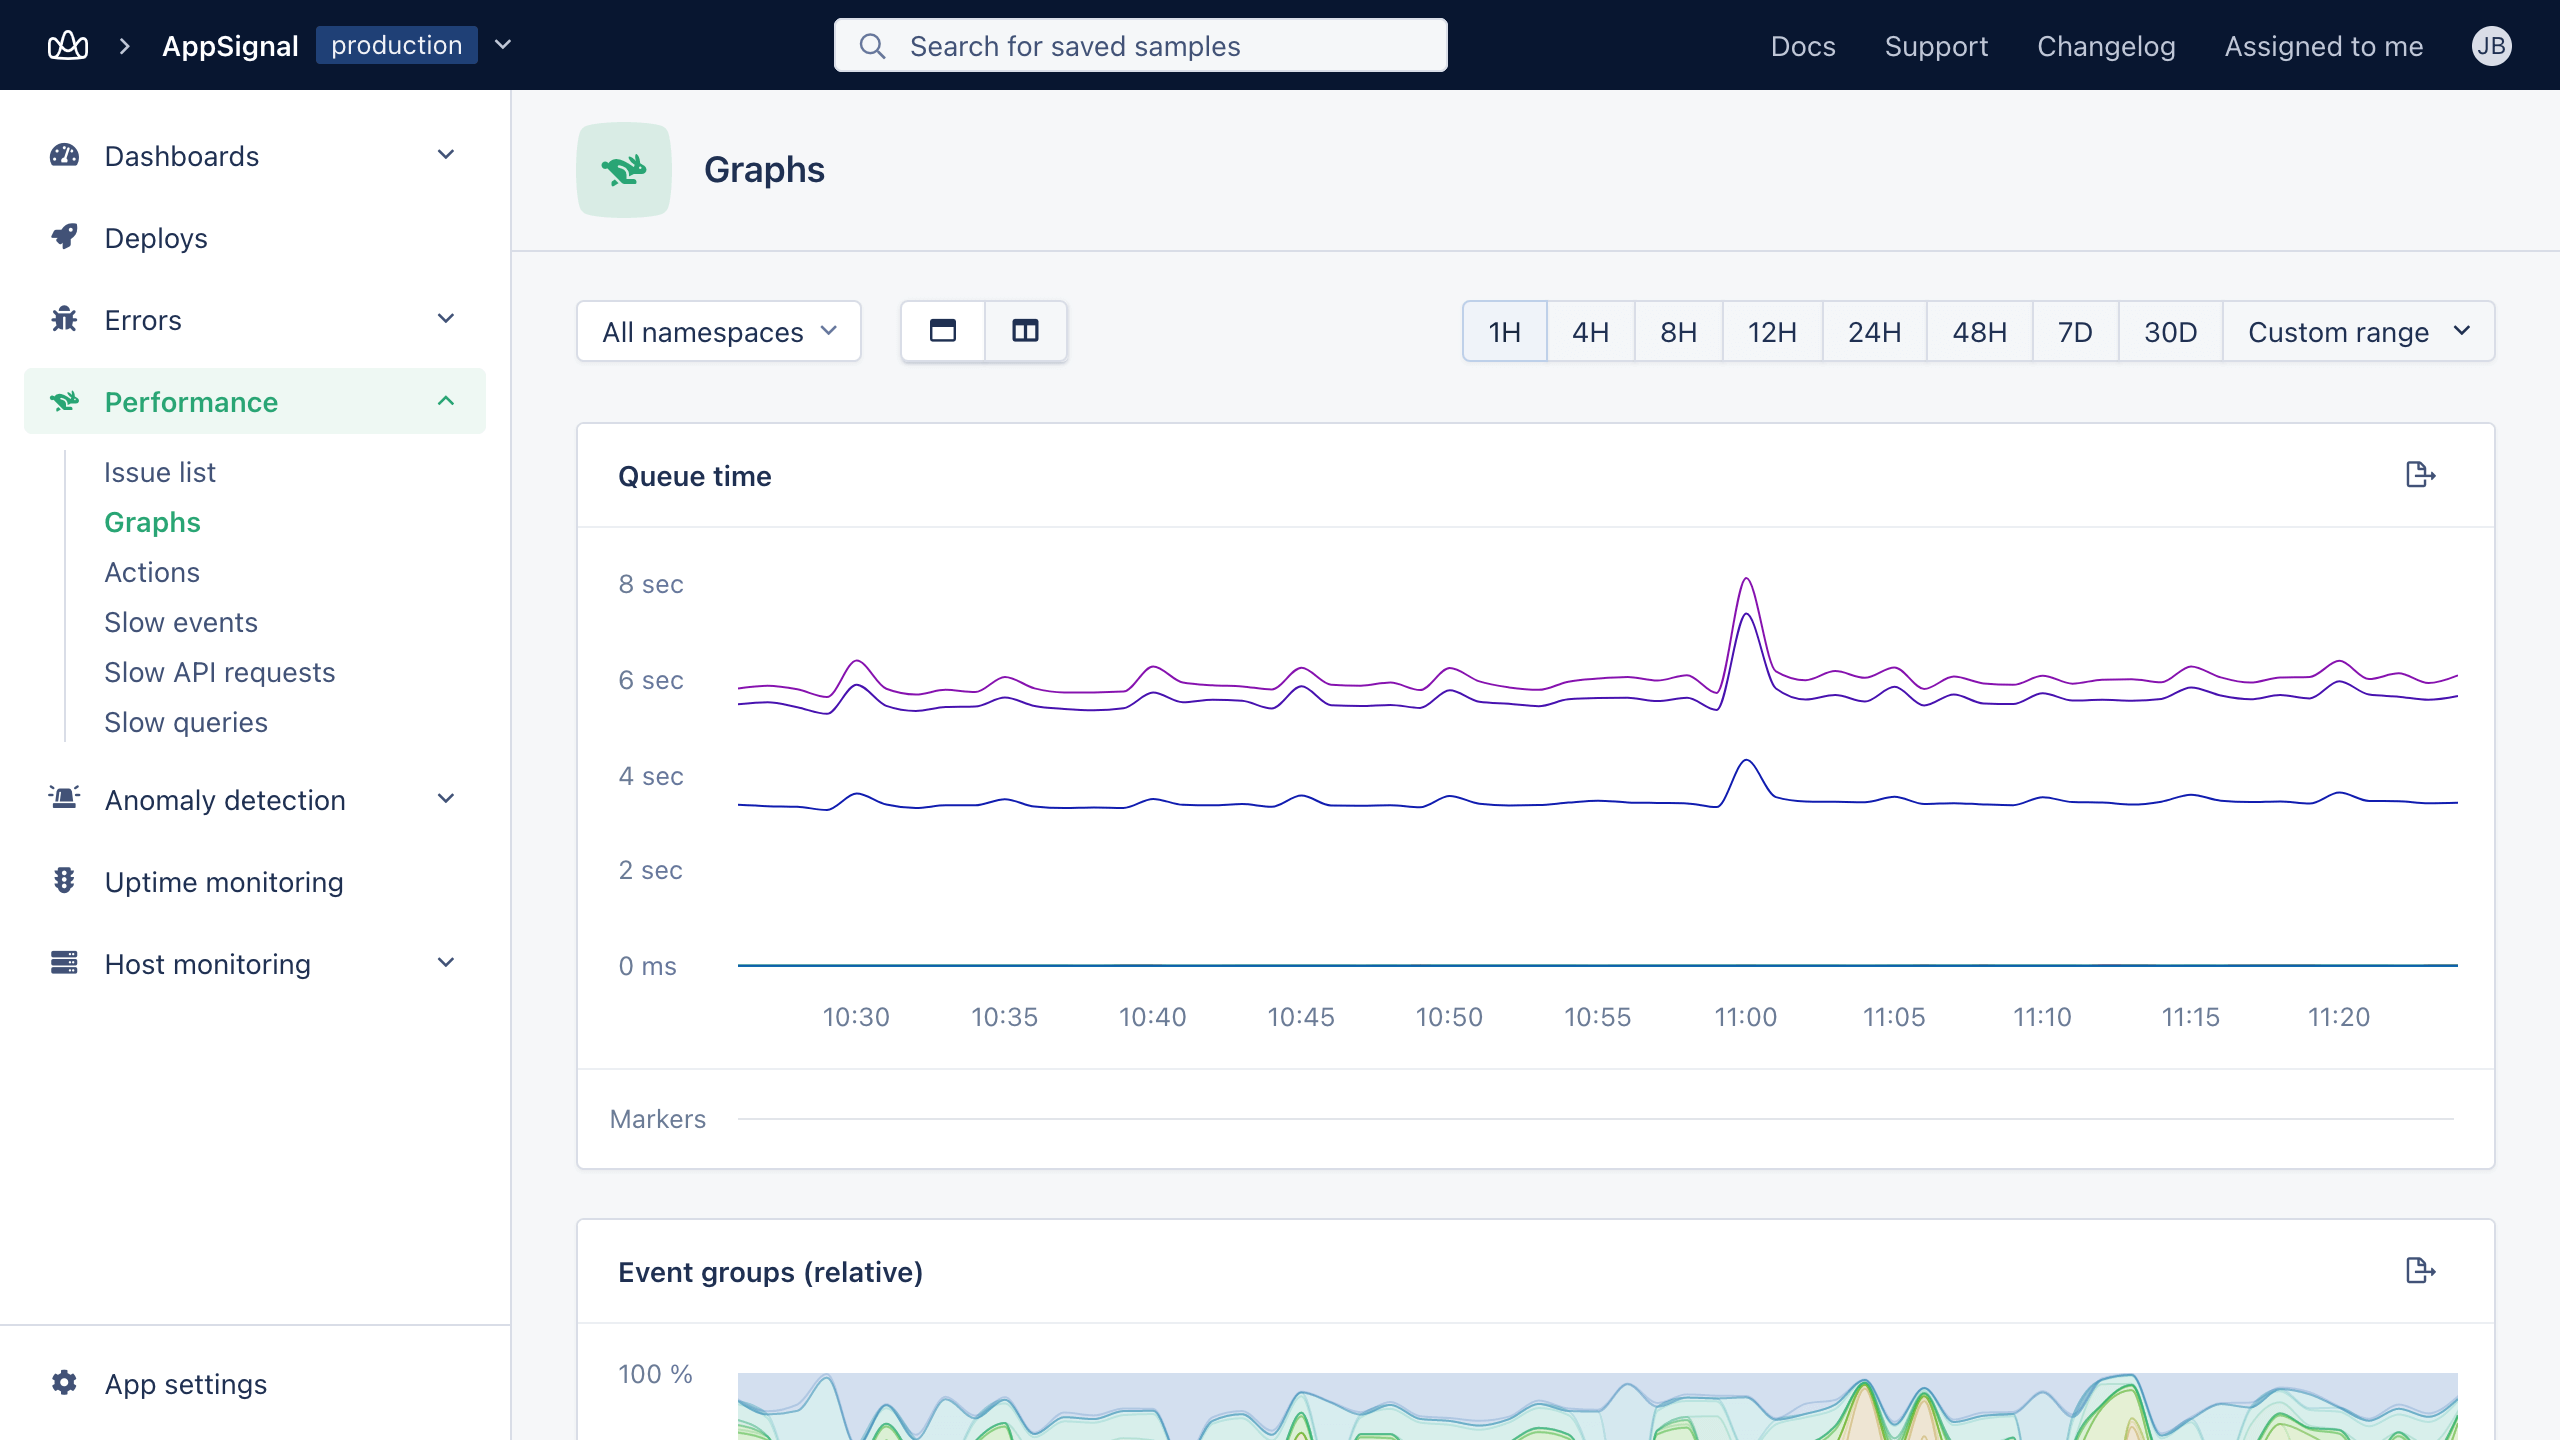
Setup
AppSignal automatically tracks the queue time on Heroku, but if you run your own server with NGINX or Apache, you’ll need to setup the correct headers for queue time tracking to work.NGINX
You can use the${msec} variable with NGINX 1.2.6 or higher. This is the current time in milliseconds.
Apache
In Apache mod_headers exposes a"$t" variable that can be used to track the queue time. Add the header as follows: