Finding Slow Queries for Ruby, Elixir, Node.js and Python
The type of events that can be found in the Slow Queries page are listed below.- Elasticsearch
- MongoDB
- MySQL
- PostgreSQL
- Redis
- SQLite
Finding Slow Queries for OpenTelemetry
For OpenTelemetry-based integrations, we look for spans with a certain set of attributes listed below. For the query body, we look for the following attributes in order:db.query.textdb.query.statementdb.stored_procedure.name
db.system.namedb.system
Unknown.
If your application is reporting queries in a differently named attribute, or you would like to customize the recognized attributes, please give us feedback.
Sorting Queries
By default the slow query list is sorted by impact: the queries that take up the most time either by duration of queries or by how often they are performed. It is also possible to sort this table by “Throughput”, how often the query has been recorded, and “Mean”, the mean duration of the queries.Query Details
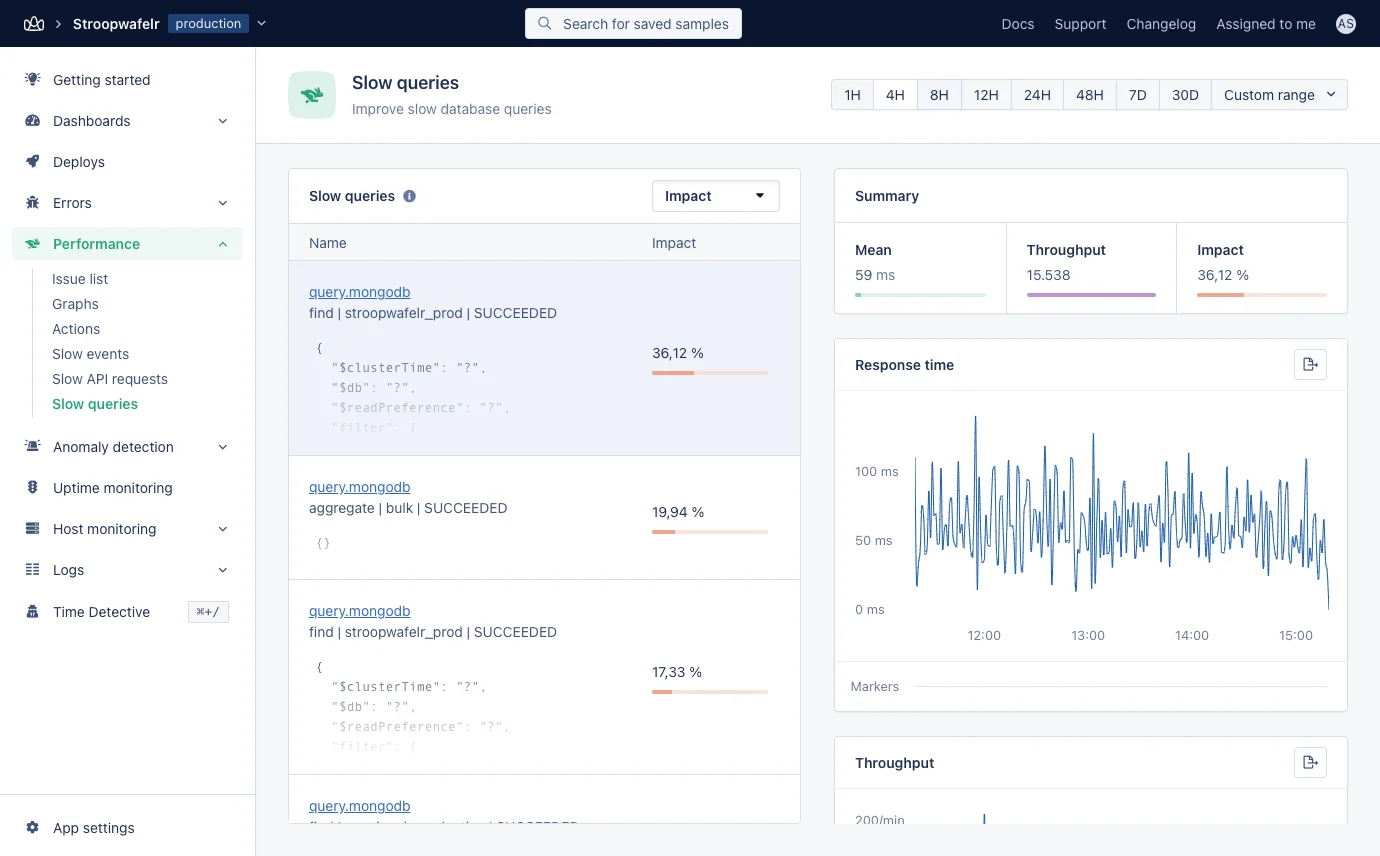
- Full query with optional event title for more context
- The database query event summary:
- Mean duration of query
- Throughput, how often the query was recorded
- The impact of the query in percentage of all database queries in the selected timeframe.
- Response time graph
- Throughput graph
- Actions and performance measurements in which the event occurred:
- You can go directly to actions and performance measurements in which the event was recorded to view the impact per request/background job in the sample event timeline.