> ## Documentation Index
> Fetch the complete documentation index at: https://docs.appsignal.com/llms.txt
> Use this file to discover all available pages before exploring further.
# MongoDB Vector source
Get more insights into the operation of your MongoDB database or cluster with our Vector MongoDB integration.
[Vector](https://vector.dev) has a [MongoDB source][source] that collects metrics from your MongoDB instances. When these MongoDB metrics are sent to AppSignal, the metrics from this Vector source will be shown in our MongoDB automatic dashboards.
## Configuration
If you've not set up Vector yet, please see the [Vector configuration
section](/vector#configuration) for more information, such as which Push
API key to use.
To send MongoDB data to AppSignal using Vector, you will need to configure the MongoDB source and AppSignal sink in your Vector configuration. We'll be using the TOML configuration file as an example.
1. Add a new source of the [`mongodb_metrics` source][source] type to your configuration file. The name of the source is the part following the dot in `sources.mongodb`, not the `mongodb_metrics` type.
```toml TOML theme={null}
[sources.mongodb]
type = "mongodb_metrics"
```
2. Configure the source's `endpoints` option with the MongoDB URL for your database. Replace the variables (`$VARIABLE_NAME`) with the values for your database, or pass them as environment variables. If running a database cluster, you should specify each member of the cluster as an endpoint.
```toml TOML theme={null}
[sources.mongodb]
type = "mongodb_metrics"
endpoints = ["$MONGODB_URL"]
# or, if running a MongoDB cluster:
# endpoints = ["$MONGODB_URL_1", "$MONGODB_URL_2", "$MONGODB_URL_3"]
```
3. Update `inputs` in the `appsignal` sink to include the name of the `mongodb_metrics` source:
```toml TOML theme={null}
[sinks.appsignal]
inputs = ["mongodb"]
# Other config
```
Shown below is an example `vector.toml` configuration file. Your [Vector configuration method][vector config] may be different.
```toml TOML theme={null}
[sources.mongodb]
type = "mongodb_metrics"
endpoints = ["$MONGODB_URL"]
[sinks.appsignal]
type = "appsignal"
inputs = ["mongodb"]
push_api_key = "Your app-level Push API key"
```
[source]: https://vector.dev/docs/reference/configuration/sources/mongodb_metrics/
[vector config]: https://vector.dev/docs/reference/configuration/
## Dashboards
From your MongoDB instances' metrics, we'll automatically set up several dashboards.
### Status dashboard
The Status dashboard focuses on the overall health and activity of your MongoDB instances.
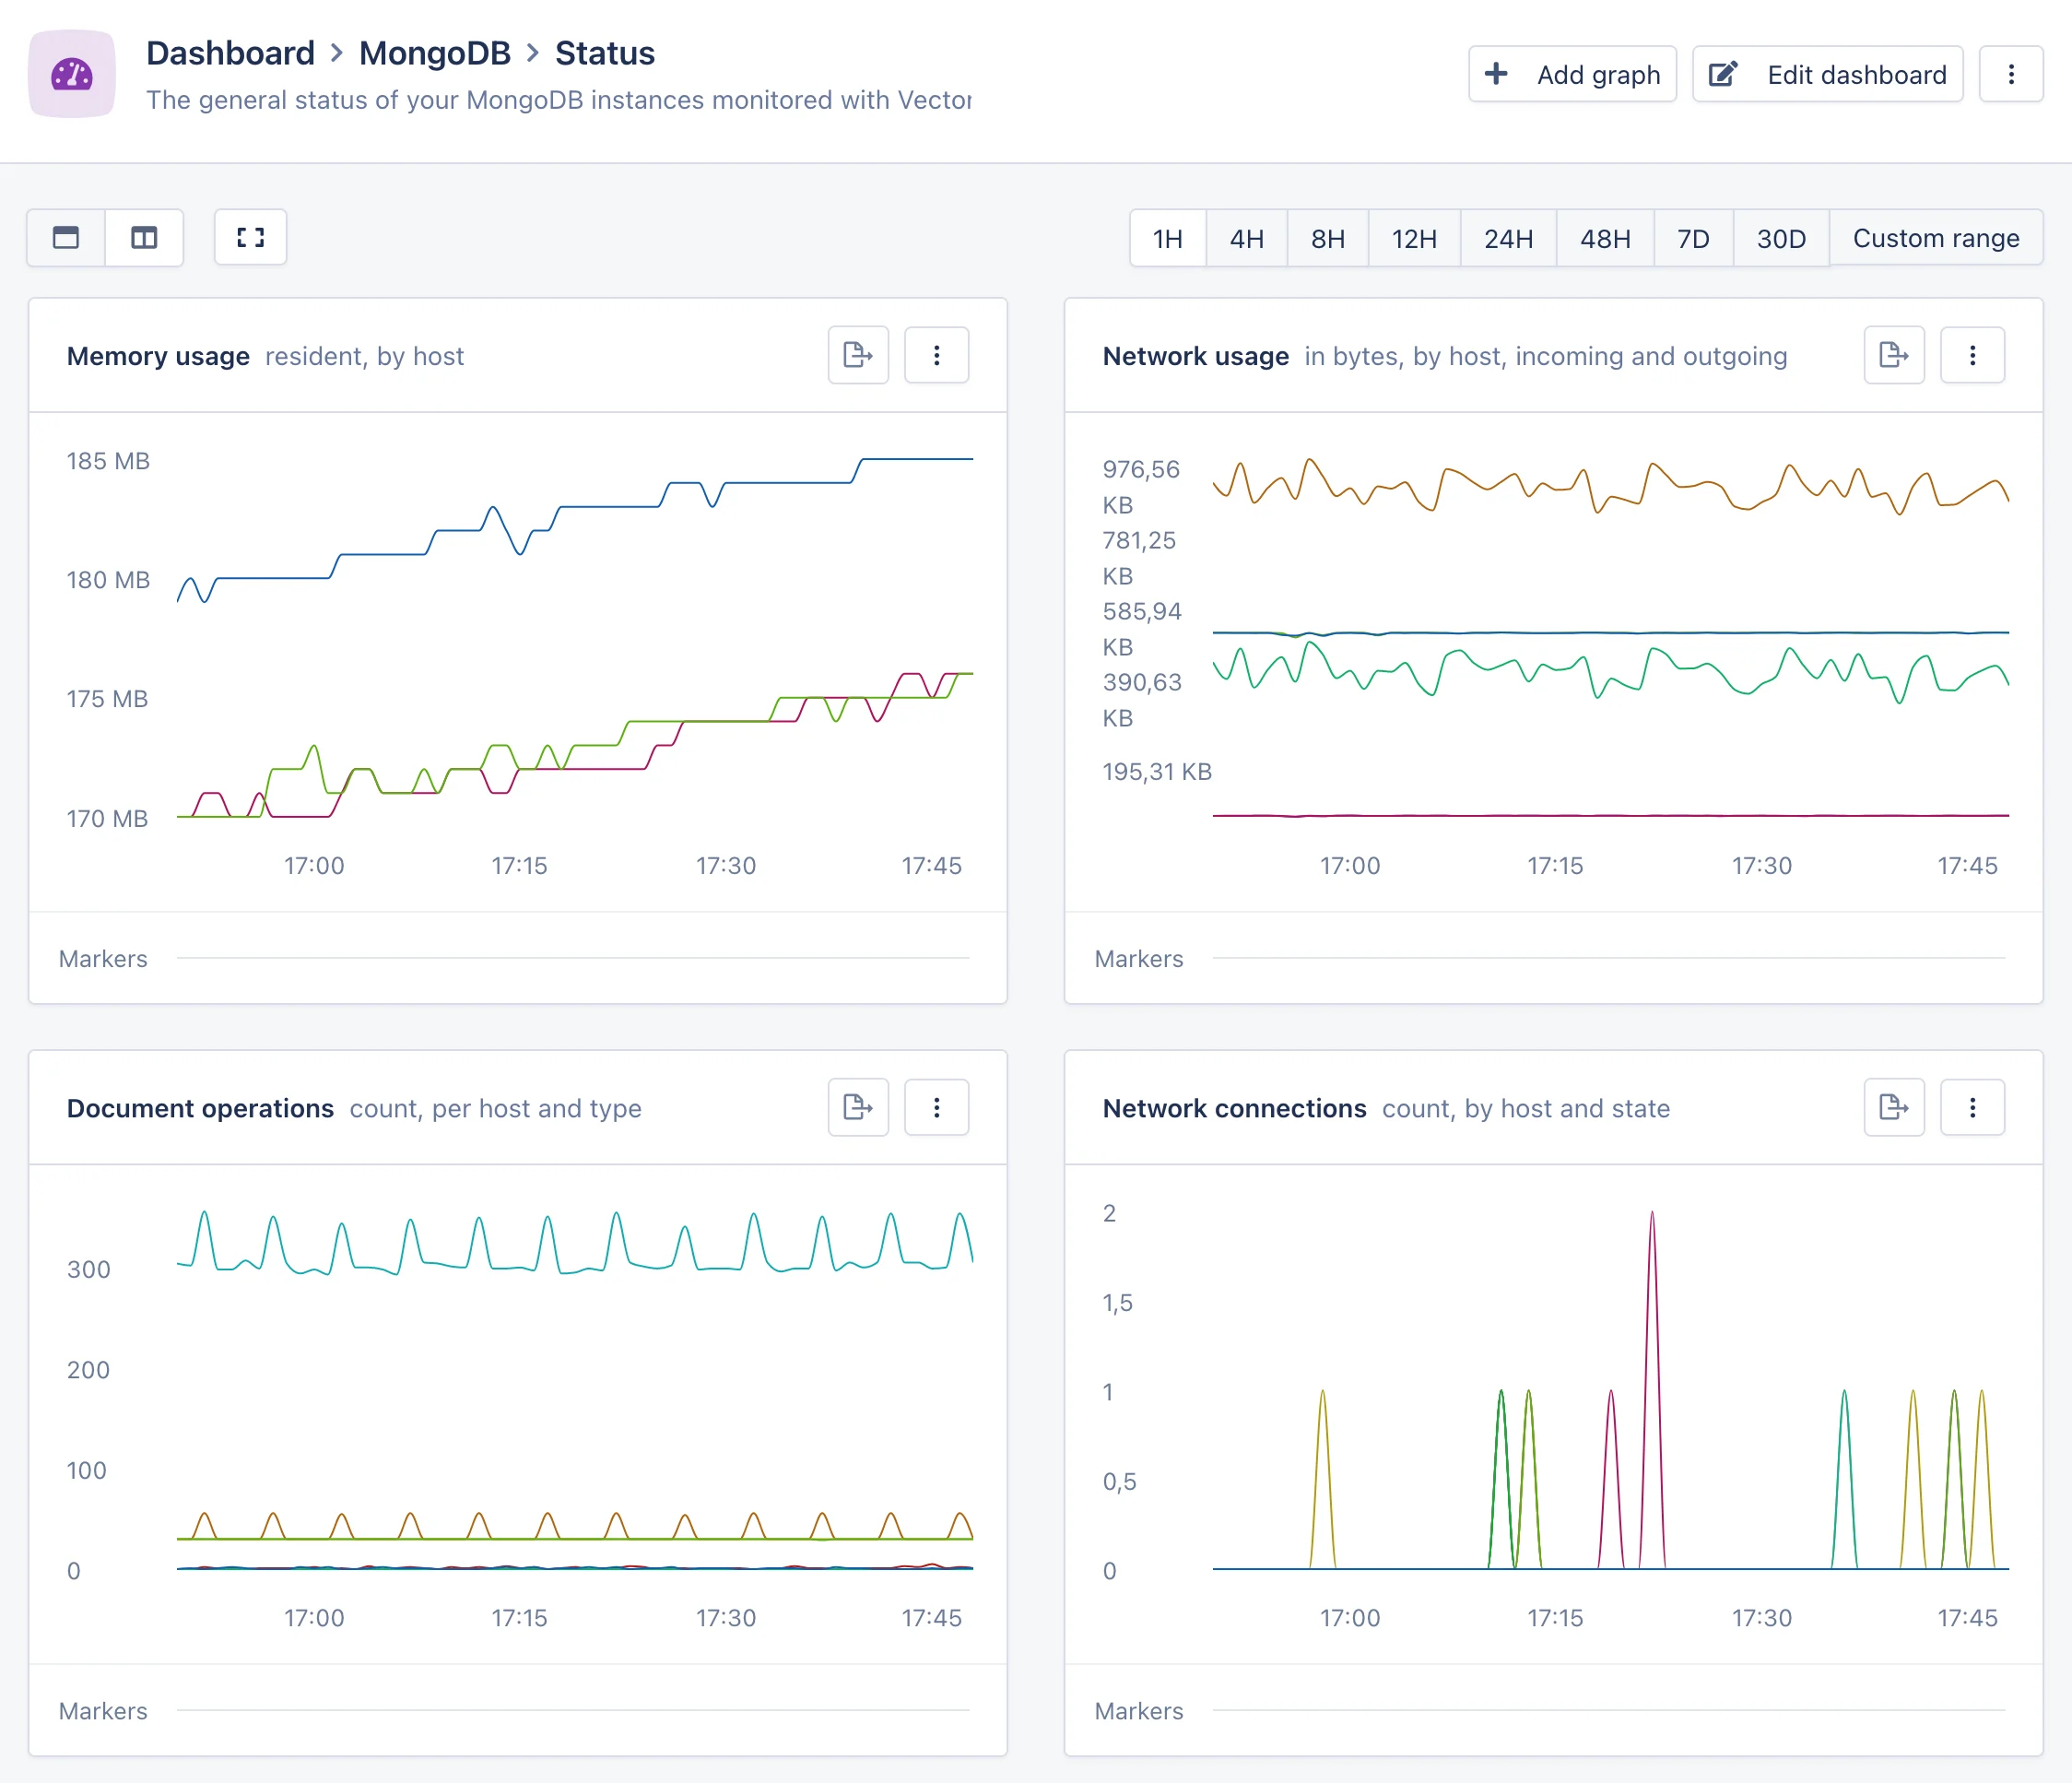 It will report graphs for memory usage, network usage, document operations and open connections.
This dashboard allows you to quickly spot what's impacting your database or your application, such as a drop in database connections or an increase in memory usage.
### WiredTiger dashboard
The WiredTiger dashboard provides an in-depth view into the internals of the MongoDB database engine.
It will report graphs for memory usage, network usage, document operations and open connections.
This dashboard allows you to quickly spot what's impacting your database or your application, such as a drop in database connections or an increase in memory usage.
### WiredTiger dashboard
The WiredTiger dashboard provides an in-depth view into the internals of the MongoDB database engine.
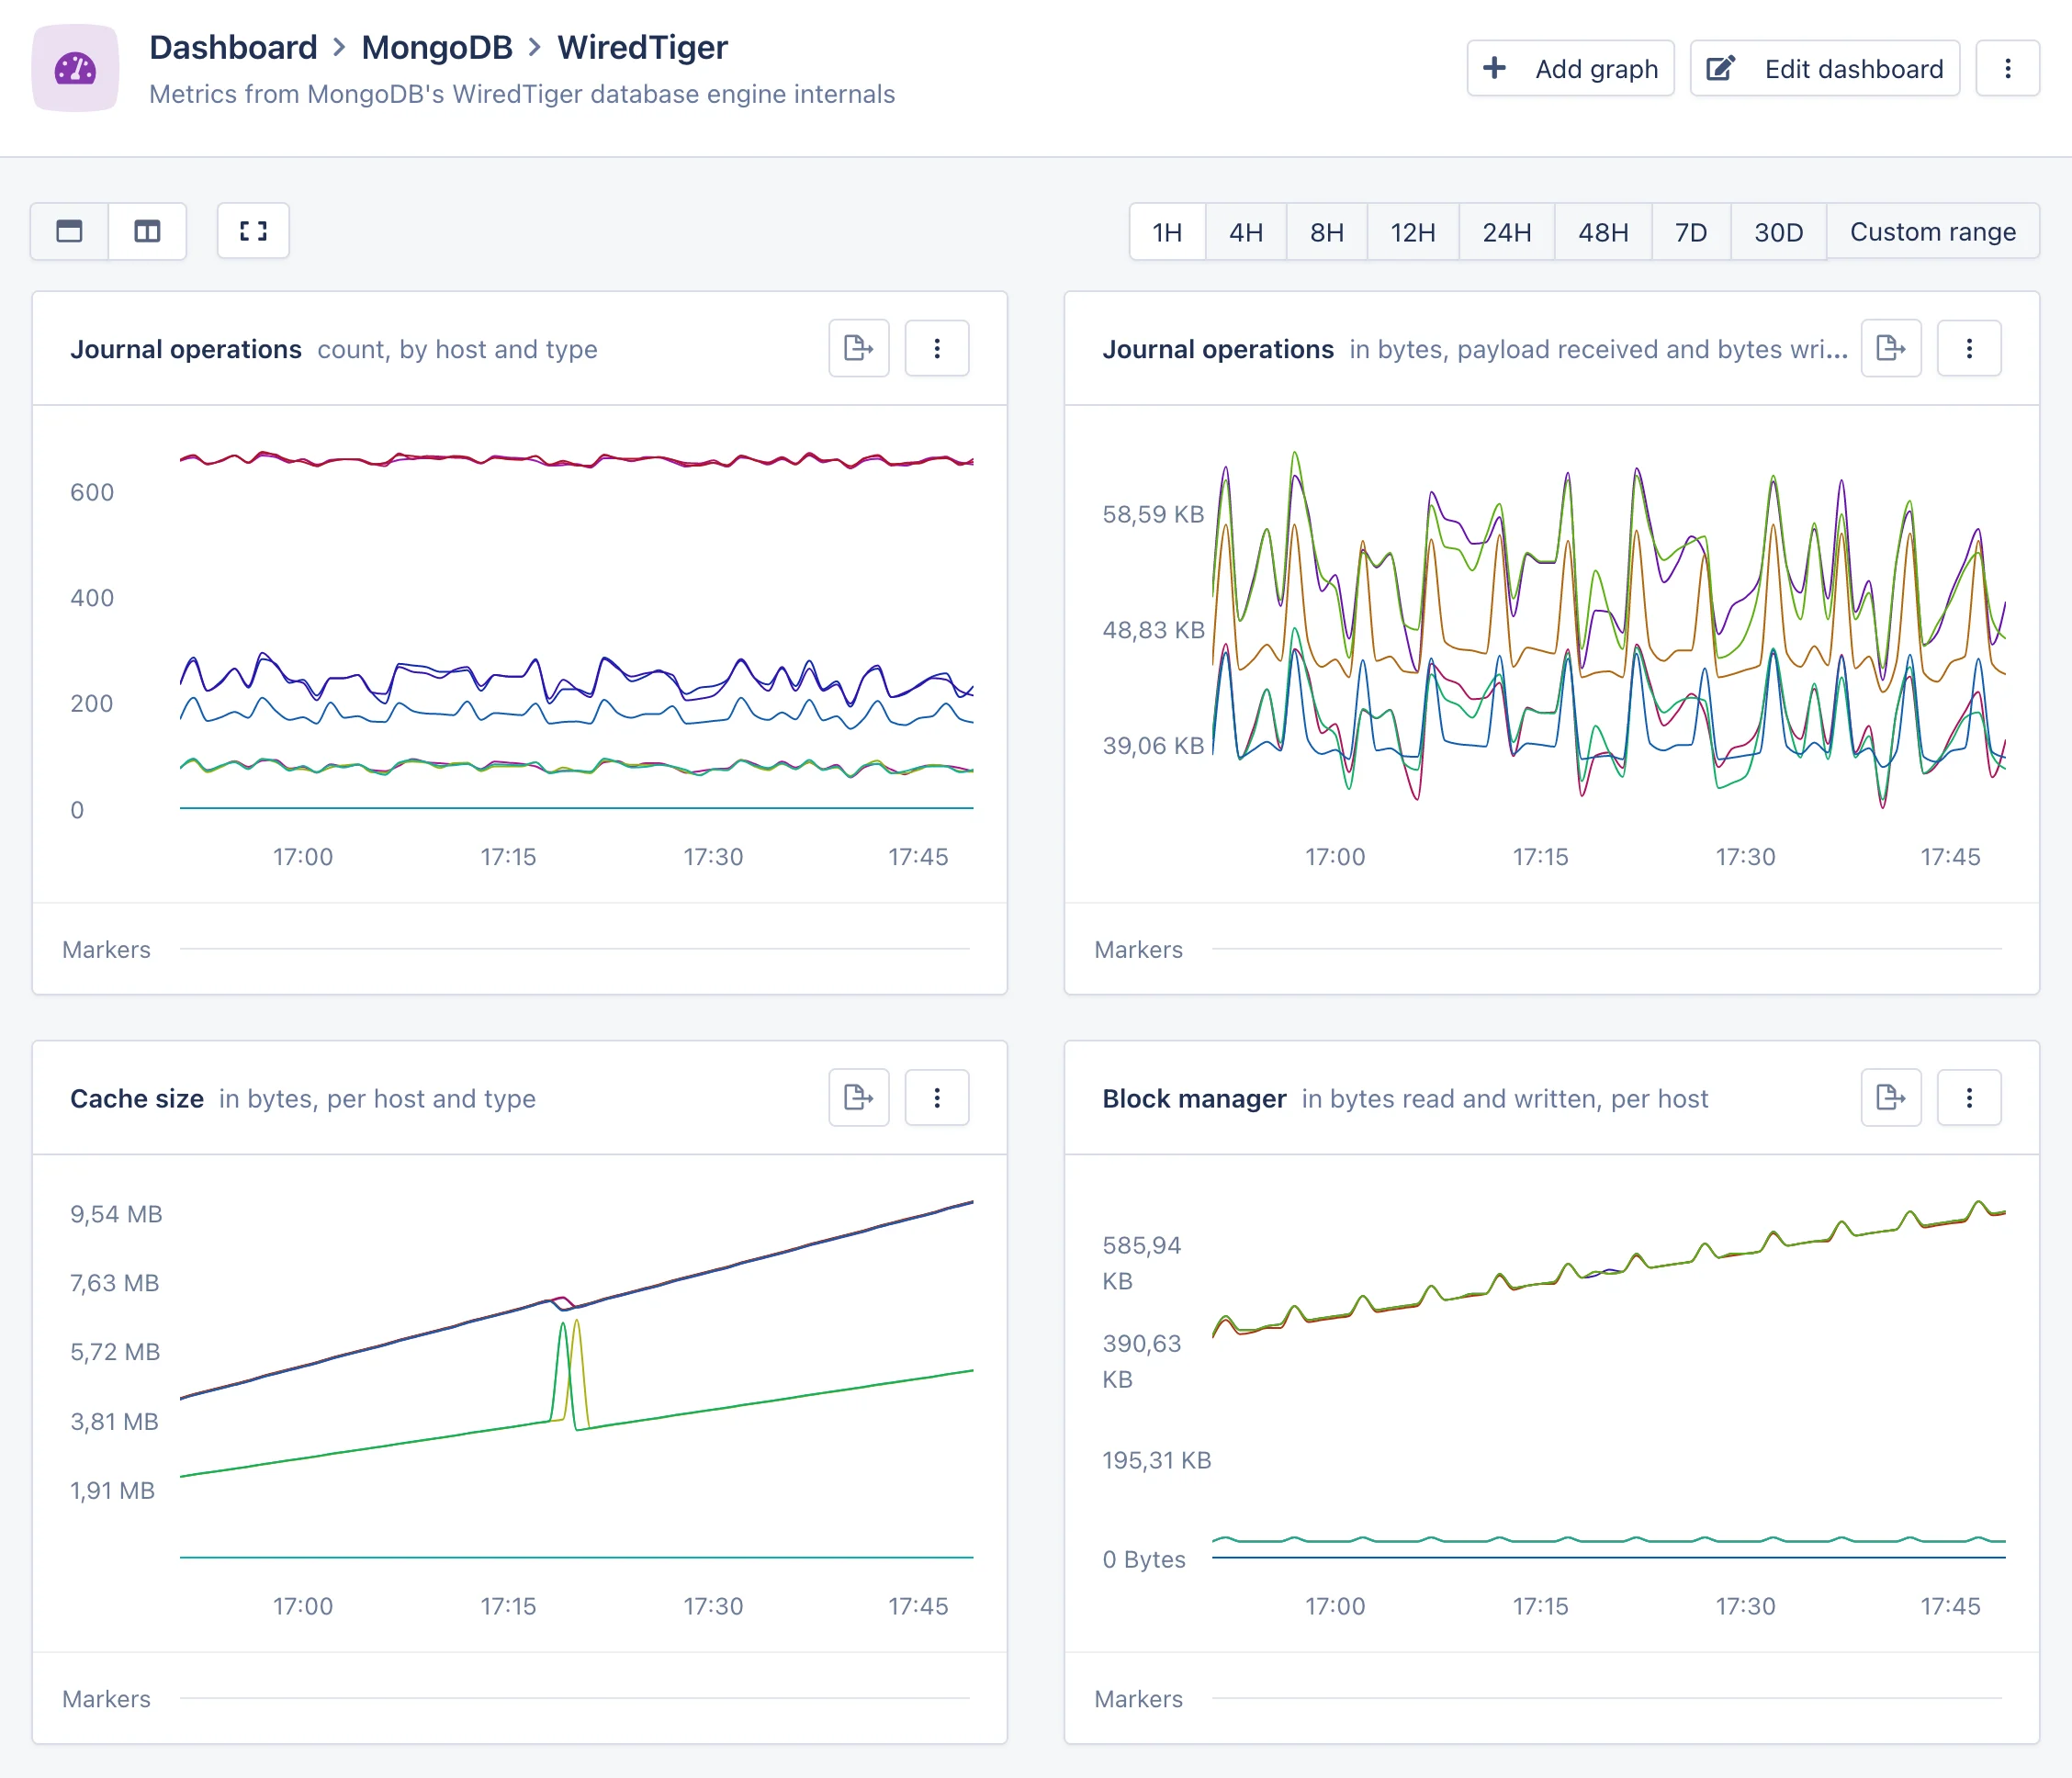 It will report graphs for journal and block manager operations, the amount of bytes read and written from disk, the amount of data in the cache, and the amount of in-progress transactions.
If you're dealing with a hard-to-track issue, such as an unexpected drop in database performance, these graphs can provide clues as to what the underlying cause is.
### Replication dashboard
The Replication dashboard provides a view into the internals of the MongoDB cluster replication system. This dashboard will only appear if you are running a MongoDB cluster.
It will report graphs for journal and block manager operations, the amount of bytes read and written from disk, the amount of data in the cache, and the amount of in-progress transactions.
If you're dealing with a hard-to-track issue, such as an unexpected drop in database performance, these graphs can provide clues as to what the underlying cause is.
### Replication dashboard
The Replication dashboard provides a view into the internals of the MongoDB cluster replication system. This dashboard will only appear if you are running a MongoDB cluster.
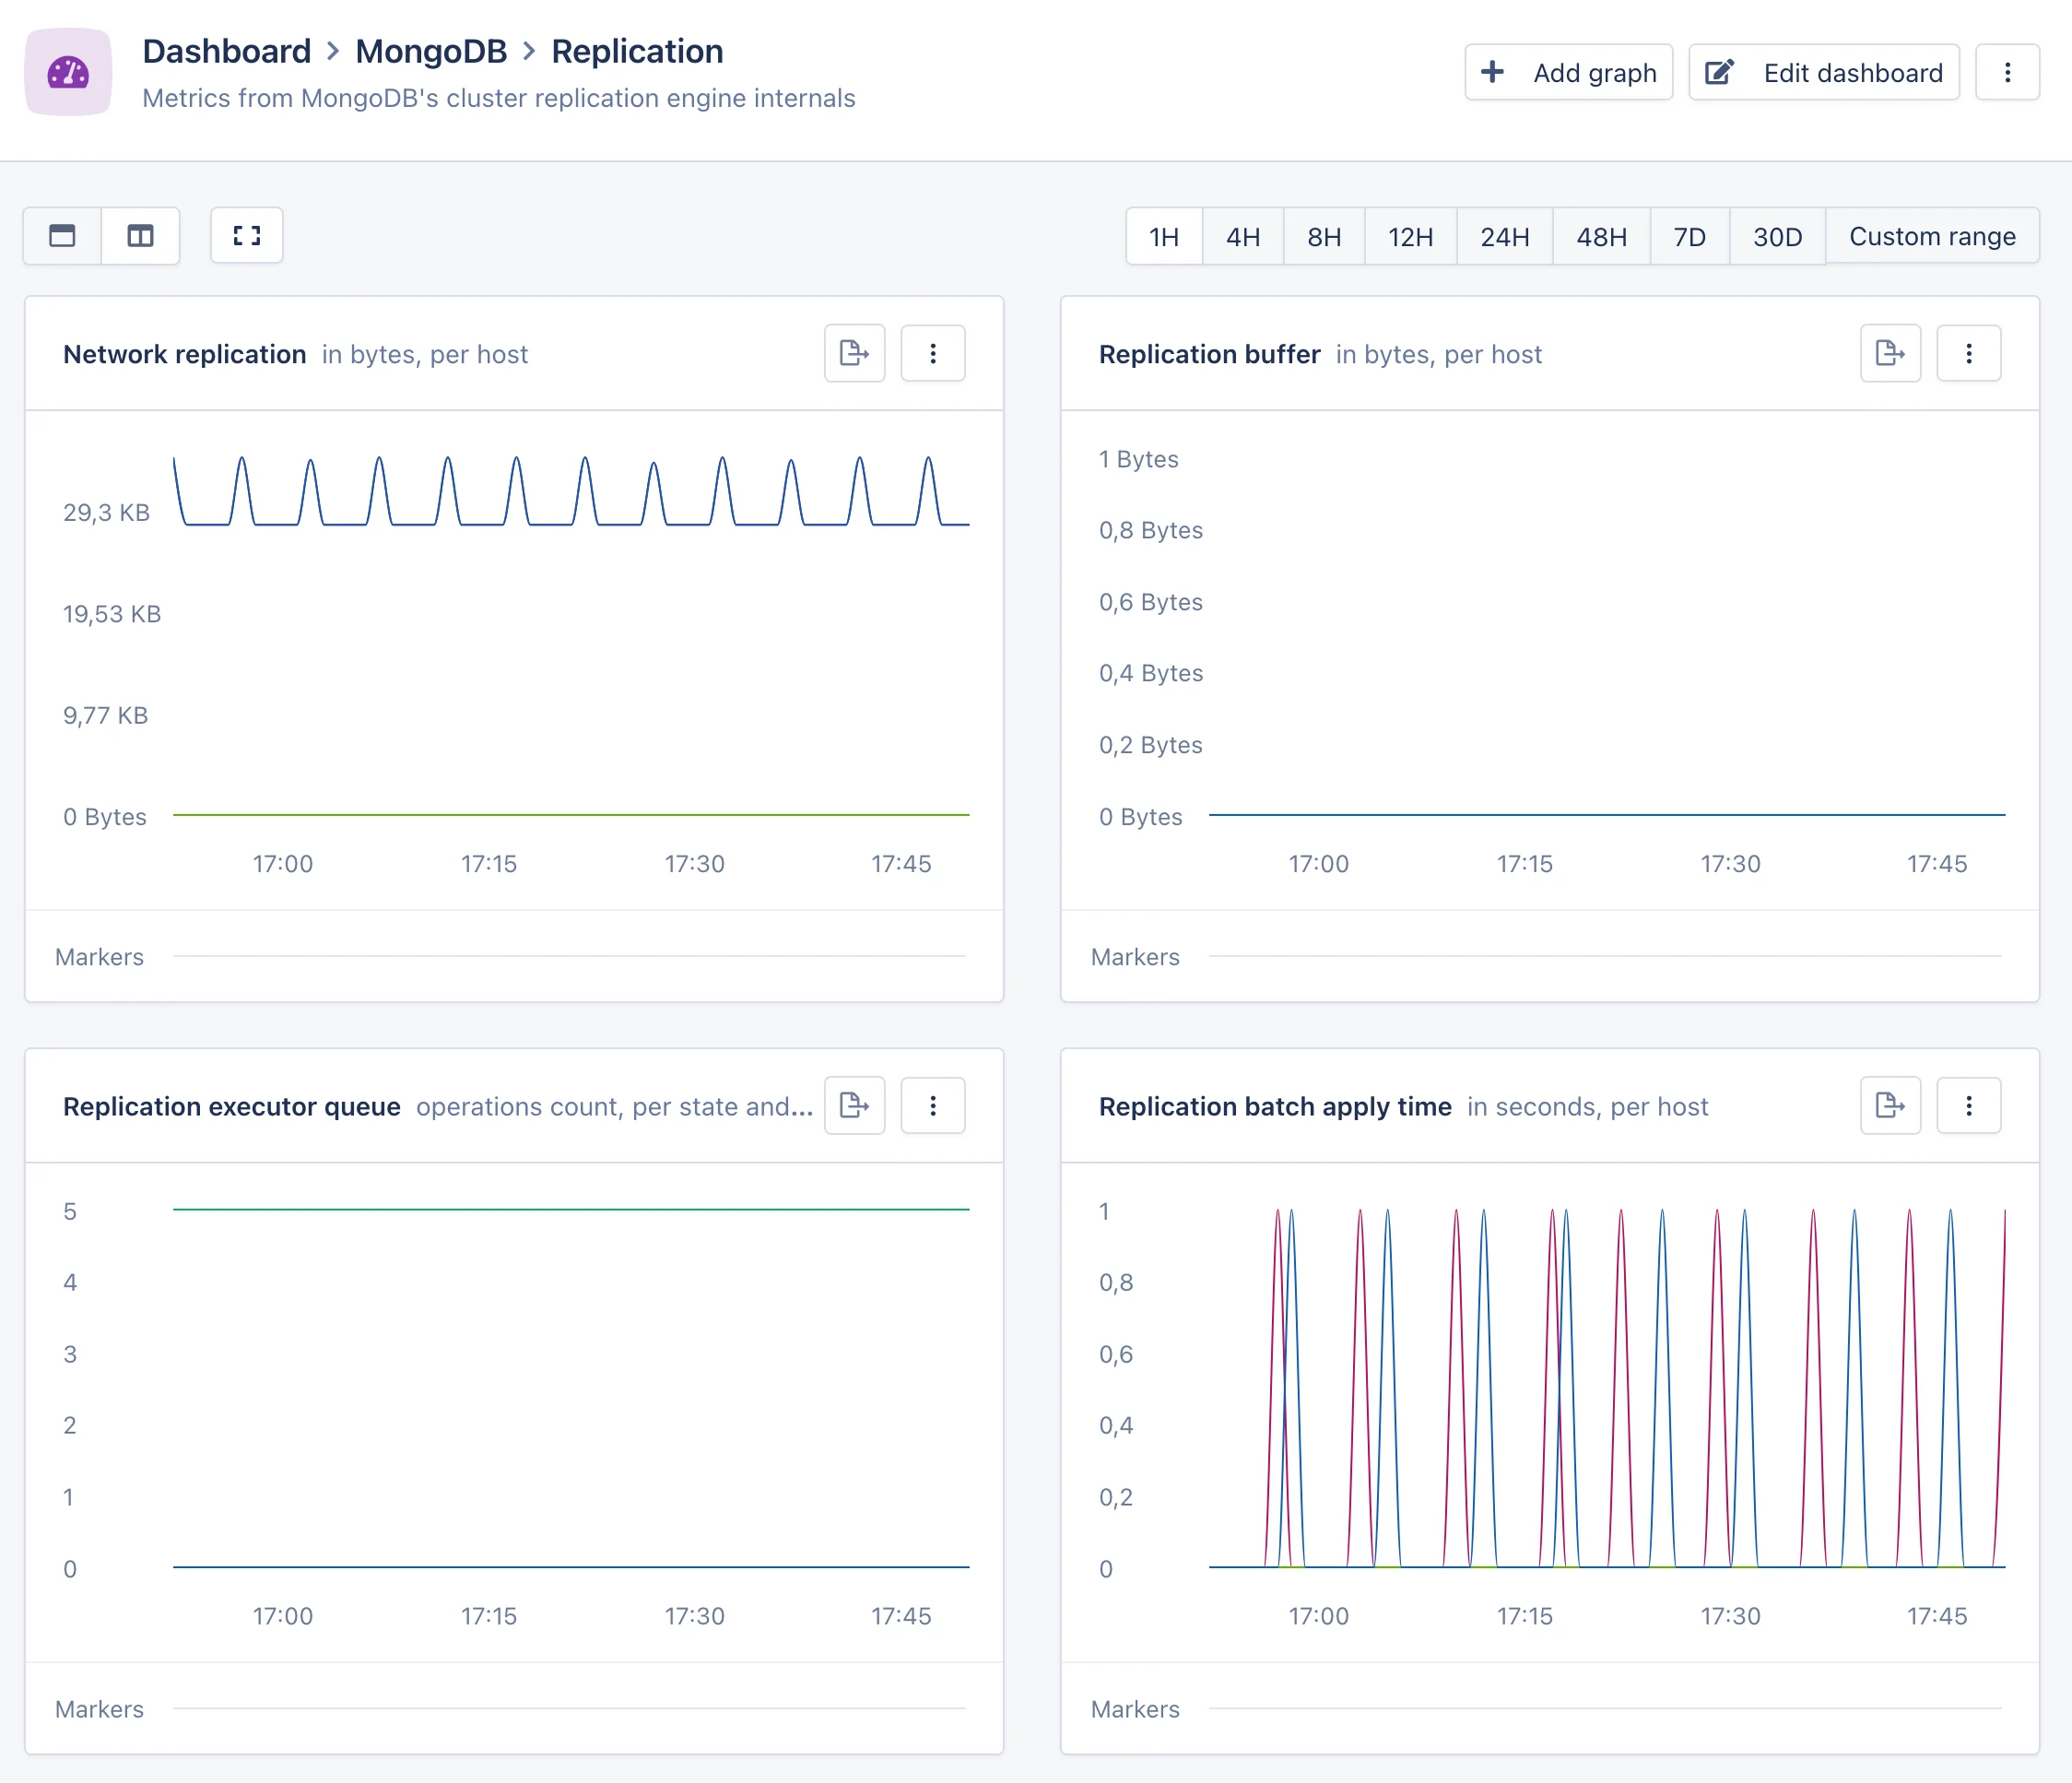 It will report graphs for the amount of network usage dedicated to replication, the size of the replication buffers, and the amount of replication operations pending execution.
This dashboard can help investigate issues related to the health of your cluster, such as stale reads and replication delays.
It will report graphs for the amount of network usage dedicated to replication, the size of the replication buffers, and the amount of replication operations pending execution.
This dashboard can help investigate issues related to the health of your cluster, such as stale reads and replication delays.