> ## Documentation Index
> Fetch the complete documentation index at: https://docs.appsignal.com/llms.txt
> Use this file to discover all available pages before exploring further.
# Traces page
> Inspect one trace: its service map, span timeline, span details, tags, related logs, triggers, and the other traces for the same action.
When you choose a trace sample to examine from the ["Performance > Traces"](https://appsignal.com/redirect-to/app?to=performance/traces) list and select one of the latest traces at a specific time, you are taken to the performance traces details page, which shows the trace's service map, timeline, tags, and related logs.
The trace page shows one stored trace for an action: a single request, background job, or other operation your app performed. A trace is made up of **spans**, the individual units of work inside it, such as an HTTP request, a database query, or a background task.
Use the page to see where the operation spent its time, review its context and logs, and decide what to do next.
The header shows the action name and its [namespace](/guides/namespaces), for example `run/shop.send_waitlist_notification` in `celery/background`. The tabs under the header switch between views of the same action: Summary, Traces, and Charts.
## Service map
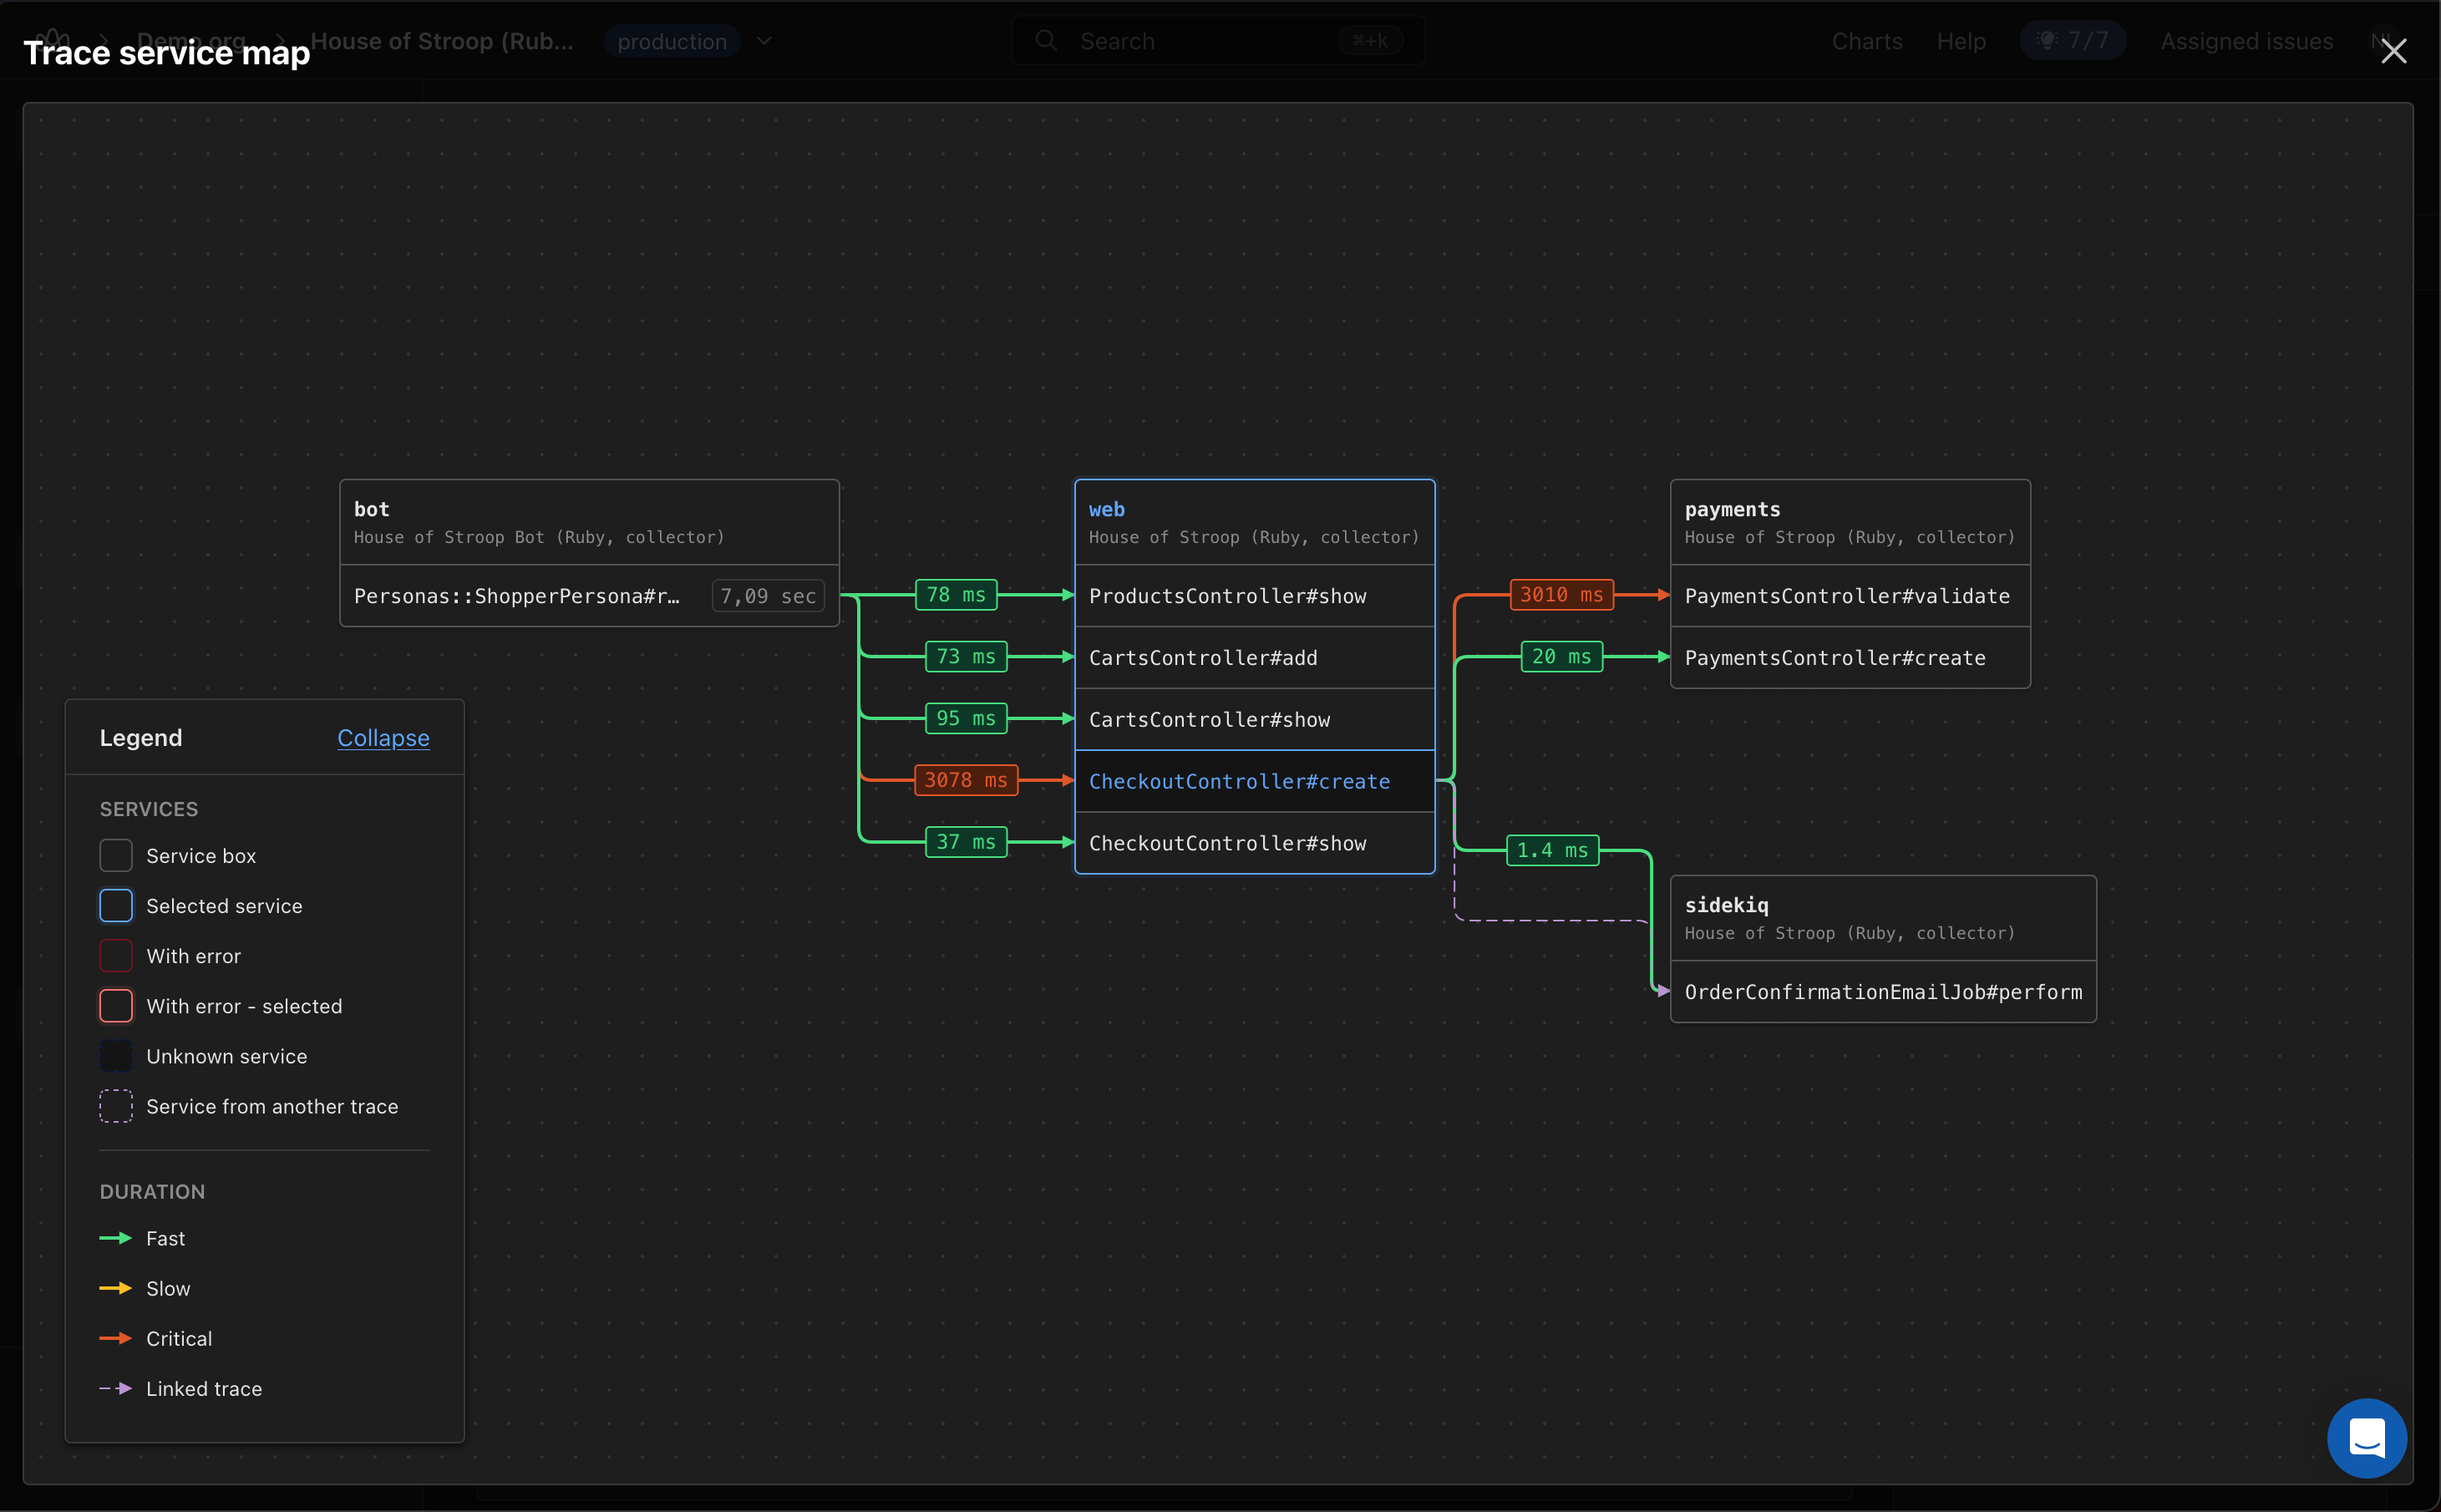
The service map shows the trace from the perspective of the services that took part: which services the request reached, and how long each call between them took. It appears only when a trace crosses more than one service, because a trace that stays inside one service has nothing to map.
* **One box per service**, grouped by `service_name`. Each box is labeled with the service name and the AppSignal application it reports to. Inside it, one row per call the service handled, so a service called twice in the same trace shows two rows. Select a row to open that service's own view of the trace.
* **Edges are the calls between services**, labeled with their duration and landing on the action row they called. This covers synchronous calls, such as an HTTP request, and asynchronous ones, such as a web app enqueuing a background job.
* **Edge color rates each call** against the trace's own baseline, as fast, slow, or critical, so the slowest hops stand out without you reading every duration. A dashed edge marks a linked trace, and a dashed box marks a service from another trace.
* **Errors mark the service they happened in**, not the service that called it.
The legend explains each color and border, and you can collapse it to see more of the map.
 ## Trace timeline
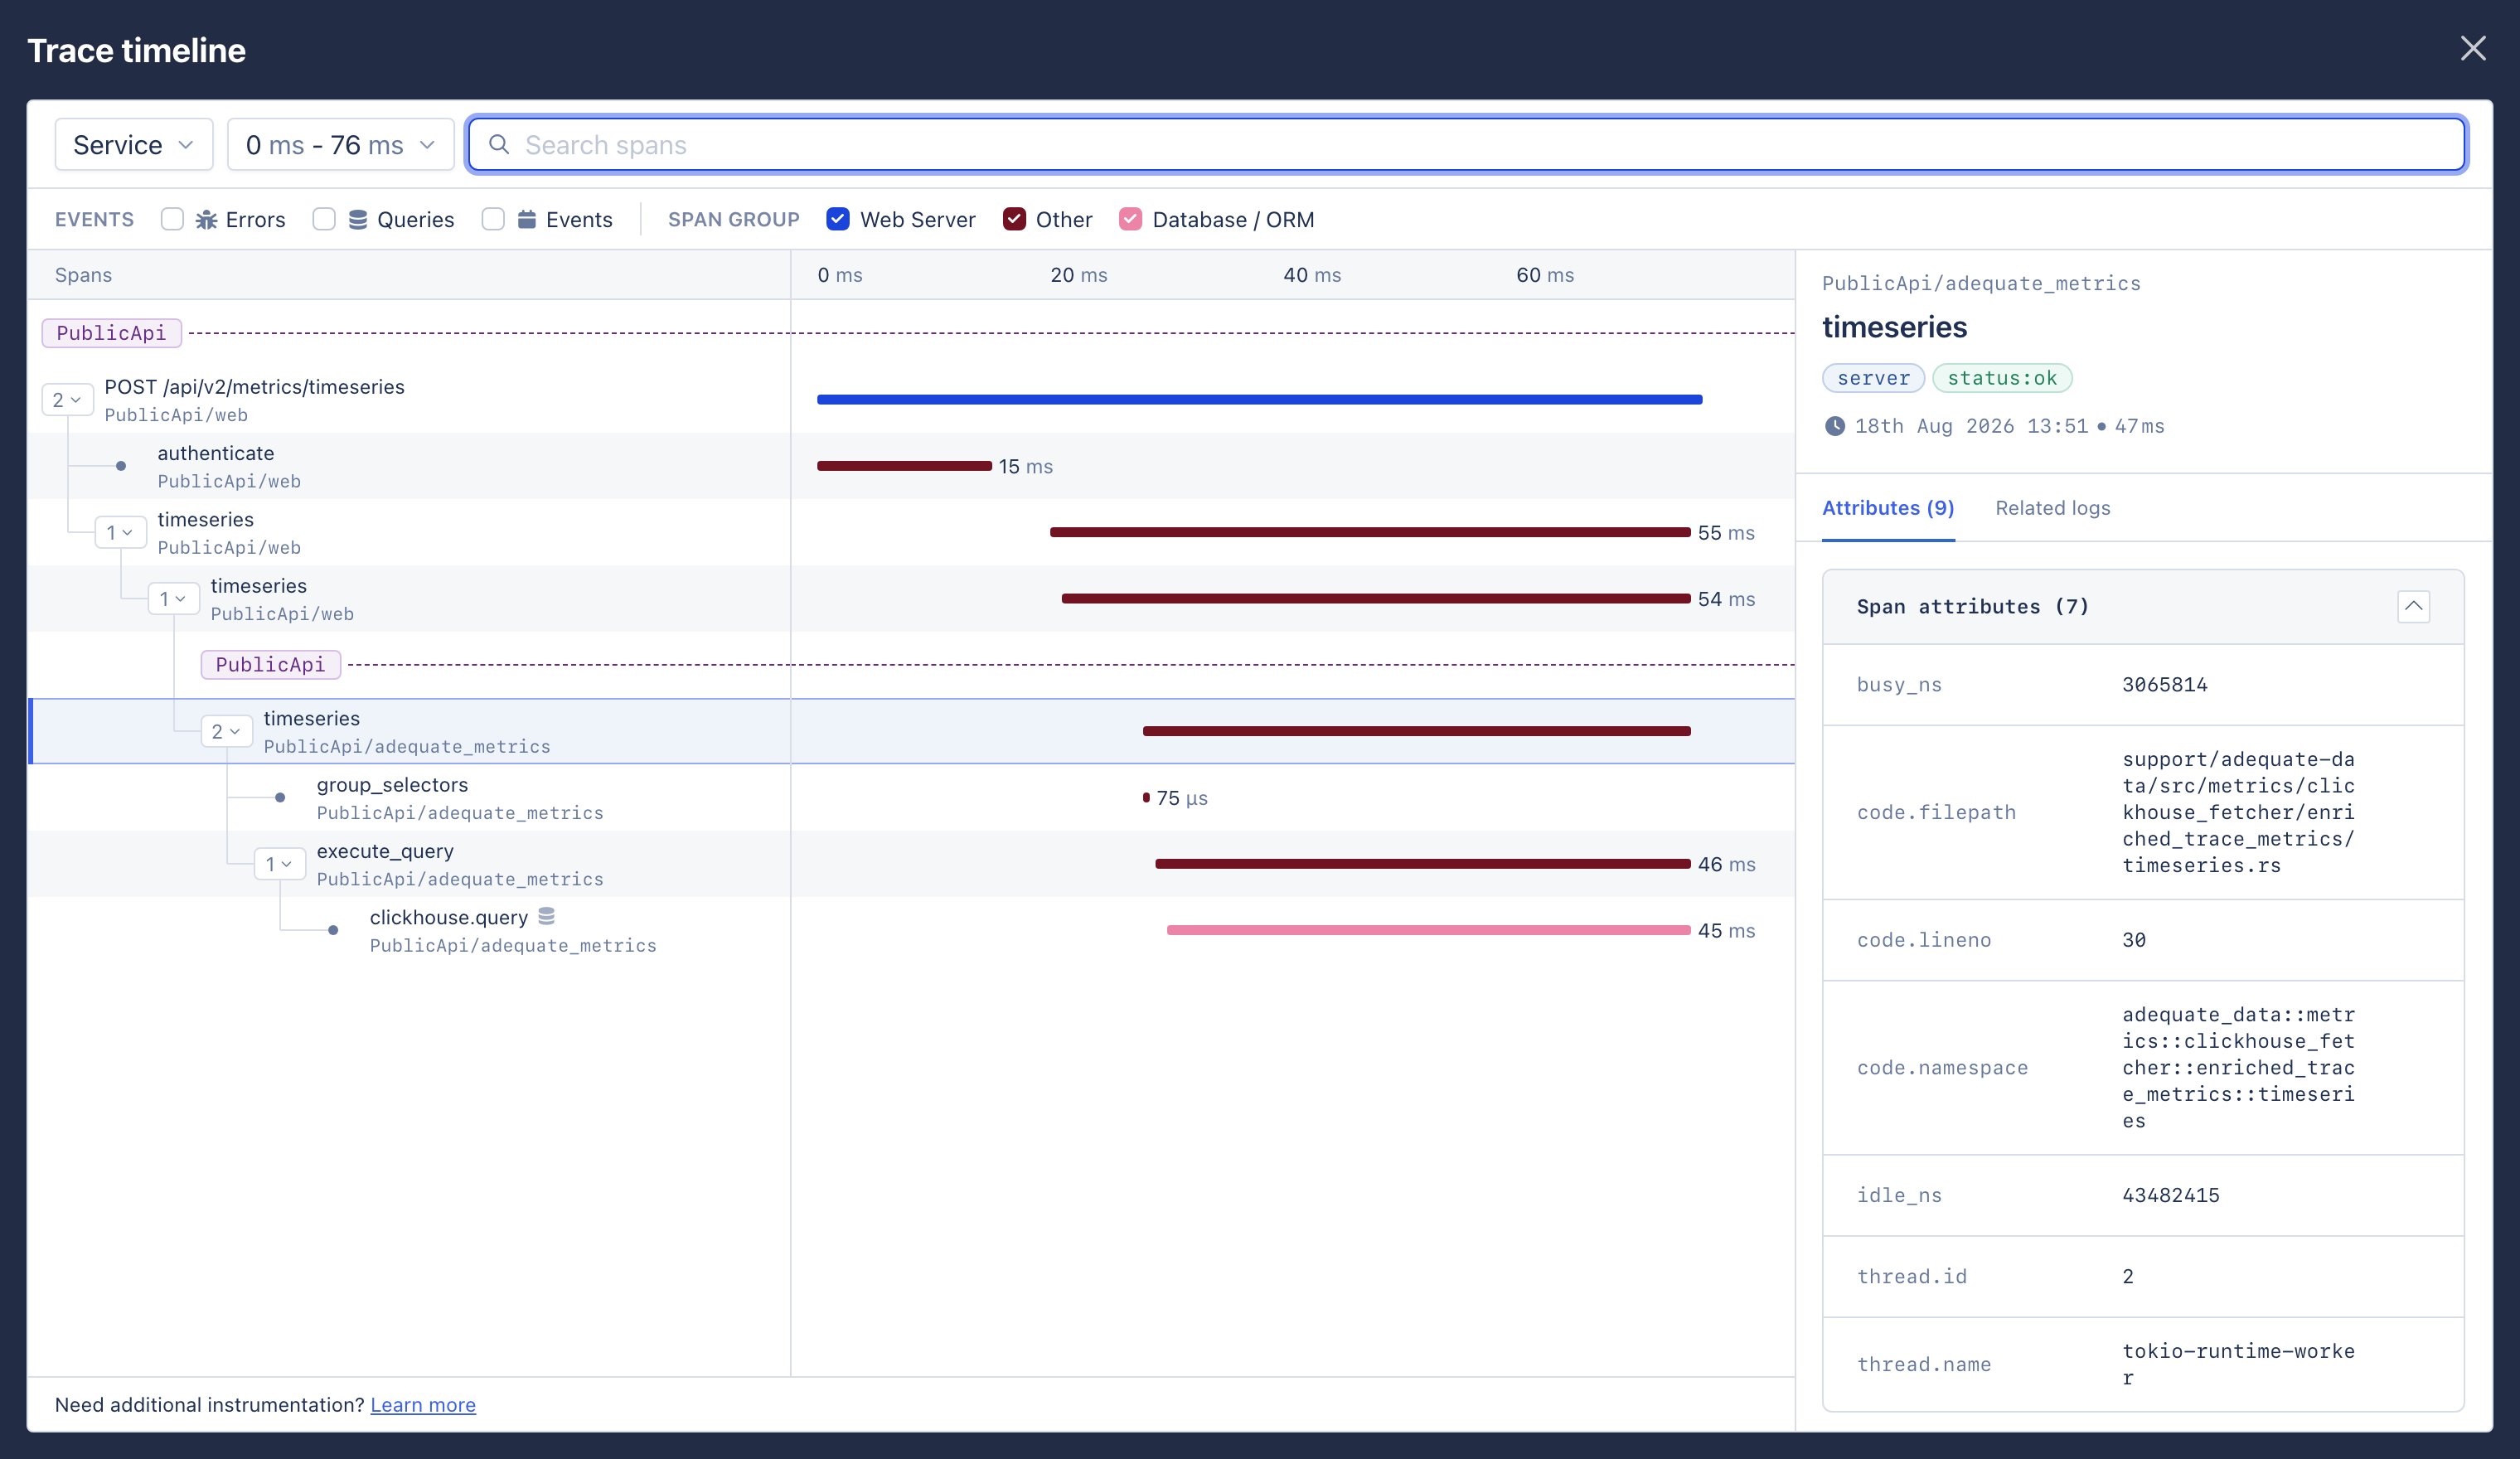
When selecting a trace sample at a specific time, the timeline lays out the trace's spans over time, from the start of the trace to its end. The position of each bar shows when a span started, its width shows how long the span ran, and its color shows the span group it belongs to. AppSignal flags issues here too, such as an N+1 event: the same query repeated many times in one operation.
The timeline follows the operation across services. In a stroopwafel shop, a Django request can queue a Celery task, the task sends an email, and an audit service records the result. Each service is labeled in the timeline, so you can see where one service hands work to the next.
Select **All spans** to open the full-screen timeline, where you can:
* Search spans by name, attribute, or event.
* Filter by event type: errors, queries, or events.
* Filter by issue, such as N+1 queries.
* Filter by span group, such as web server, database and ORM, HTTP, or other.
* Filter by service, or narrow the timeline to part of the trace's duration.
* Expand and collapse nested spans. A badge shows how many child spans a span has, and a repeat badge such as `x6` shows how often the same span ran.
* Select a span to open its details.
## Trace timeline
When selecting a trace sample at a specific time, the timeline lays out the trace's spans over time, from the start of the trace to its end. The position of each bar shows when a span started, its width shows how long the span ran, and its color shows the span group it belongs to. AppSignal flags issues here too, such as an N+1 event: the same query repeated many times in one operation.
The timeline follows the operation across services. In a stroopwafel shop, a Django request can queue a Celery task, the task sends an email, and an audit service records the result. Each service is labeled in the timeline, so you can see where one service hands work to the next.
Select **All spans** to open the full-screen timeline, where you can:
* Search spans by name, attribute, or event.
* Filter by event type: errors, queries, or events.
* Filter by issue, such as N+1 queries.
* Filter by span group, such as web server, database and ORM, HTTP, or other.
* Filter by service, or narrow the timeline to part of the trace's duration.
* Expand and collapse nested spans. A badge shows how many child spans a span has, and a repeat badge such as `x6` shows how often the same span ran.
* Select a span to open its details.
 ### Span details
The details panel names the span and shows its kind, such as `consumer`, its status, its start time, and its duration. Three tabs give the rest:
* **Attributes**: the span attributes, such as `celery.task_name` and `messaging.destination`, and the resource attributes, such as `host.name` and `service.name`. Select **Show internal attributes** to also list the attributes AppSignal adds. The trace ID and the span ID are visible **only** while **Show internal attributes** is selected.
* **Exceptions** or **Events**: the errors and other events recorded on the span. A span that raised an error also shows a summary at the top of the panel, with an action to view the exception.
* **Related logs**: the log lines linked to the span. Select **View in logs** to continue in the [log explorer](/logging).
The **Related logs** tab opens with its scope set to **This span**, so it searches only for the log lines of the span you selected. Set the scope to **Entire trace** to widen the search to every log line linked to the trace, across all of its spans and services.
### Trace breakdown
The trace breakdown summarizes the whole trace in two stacked bars. In both, each segment is one of the libraries that did the work, such as `active_record`, `http_rb`, or `sidekiq`, and the legend lists every library with its own total, largest first.
* **Durations**: how much of the trace's time each library accounts for.
* **Allocations**: how many objects each library allocated, with the trace's total in the heading.
## Tags
Tags are the key and value pairs recorded with the trace, such as `hostname`, `queue`, `message_id`, and `revision`.
Each tag has two actions:
* **Filter** narrows the Traces list to the traces of this action that carry the same value. The value stays visible above the list, and **Reset** clears it.
* **Search** opens an overview of everything AppSignal recorded with that value. You can narrow the overview by app, namespace, time range, and type, so you see only the errors or only the performance traces that share it. Select **Go to trace** on any result to open it.
To turn a tag value into a link to your own application, use [link templates](/application/link-templates). To send more tags from your app, see [tagging](/application/tagging).
## Related logs
The log lines linked to this trace, with their time, severity, and message. In the stroopwafel example, they show the waitlist task starting, the email delivery failing, and the retry that follows. Select **Open in the log view** to continue in the [log explorer](/logging).
The panel reports when it finds no related log lines. AppSignal links a log line to a trace by a shared `request_id` or `trace_id`, so the panel stays empty when the operation logged nothing, when your app does not send logs to AppSignal yet, or when the identifier is missing from one of the two. See [configure logging](/logging/configuration) to send logs, and [link traces with logs](/guides/linking-traces-with-logs) for the identifiers.
## Request details
For web requests, the page also shows the raw data AppSignal received, in three panels:
* **Request headers**: the HTTP headers sent with the request. Use [header filtering](/application/header-filtering) to choose which headers your app sends.
* **Request payload**: the request body, such as a GraphQL query and its variables. Use [parameter filtering](/application/parameter-filtering) to keep sensitive values out.
* **Request session data**: the session values for the request. Use [session data filtering](/application/session-data-filtering) to keep sensitive values out.
## Performance trends
A chart of the action's performance over the last 24 hours or 30 days.
## Triggers
Triggers alert you when this action gets slow. The panel lists the triggers that already exist for the action, such as `Mean > 200 ms`.
Select **Add new** to open the trigger form with the namespace and action name filled in. In the form, you:
* Choose the value to alert on, such as the mean, and the threshold above which AppSignal alerts, such as 200 ms.
* Set an alert warm-up and an alert cooldown in minutes.
* Add a description for the people who receive the alert.
* Select the notifiers that receive it, such as email, Slack, PagerDuty, or OpsGenie.
For how alerts open, close, and repeat, see [anomaly detection](/anomaly-detection) and [warm-up and cooldown](/anomaly-detection#warm-up-and-cooldown).
## Actions
* **Time Detective**: review your application's data as it was at the time of the trace.
* **Send to your issue tracker**: create an issue from the trace. This action appears when a tracker is connected, and its label matches that tracker, such as GitHub, GitLab, Jira, or Linear. See [integrations](/application/integrations).
## Traces
The Traces panel lists the other stored traces for this action, each with its timestamp and duration. Select any of them to open that trace.
To find a specific trace:
* Enter a value in the tag filter field, or use the **Filter** action on a tag, to keep only the traces that carry that value.
* Open the date control to pick a date and time, or choose **Today**, **Yesterday**, **Last week**, or **Latest**. Select **Jump to latest** to return to the most recent traces.
* Select **Load newer traces** or **Load older traces** to move through the list.
* Select **Reset** to clear the filters and see every stored trace again.
A [deploy marker](/application/markers) between two traces shows where a new revision took over, which helps you compare traces from before and after a deploy.
AppSignal does not store a trace for every request. It stores a representative set instead, so the list shows a sample of the action's traffic.
### Span details
The details panel names the span and shows its kind, such as `consumer`, its status, its start time, and its duration. Three tabs give the rest:
* **Attributes**: the span attributes, such as `celery.task_name` and `messaging.destination`, and the resource attributes, such as `host.name` and `service.name`. Select **Show internal attributes** to also list the attributes AppSignal adds. The trace ID and the span ID are visible **only** while **Show internal attributes** is selected.
* **Exceptions** or **Events**: the errors and other events recorded on the span. A span that raised an error also shows a summary at the top of the panel, with an action to view the exception.
* **Related logs**: the log lines linked to the span. Select **View in logs** to continue in the [log explorer](/logging).
The **Related logs** tab opens with its scope set to **This span**, so it searches only for the log lines of the span you selected. Set the scope to **Entire trace** to widen the search to every log line linked to the trace, across all of its spans and services.
### Trace breakdown
The trace breakdown summarizes the whole trace in two stacked bars. In both, each segment is one of the libraries that did the work, such as `active_record`, `http_rb`, or `sidekiq`, and the legend lists every library with its own total, largest first.
* **Durations**: how much of the trace's time each library accounts for.
* **Allocations**: how many objects each library allocated, with the trace's total in the heading.
## Tags
Tags are the key and value pairs recorded with the trace, such as `hostname`, `queue`, `message_id`, and `revision`.
Each tag has two actions:
* **Filter** narrows the Traces list to the traces of this action that carry the same value. The value stays visible above the list, and **Reset** clears it.
* **Search** opens an overview of everything AppSignal recorded with that value. You can narrow the overview by app, namespace, time range, and type, so you see only the errors or only the performance traces that share it. Select **Go to trace** on any result to open it.
To turn a tag value into a link to your own application, use [link templates](/application/link-templates). To send more tags from your app, see [tagging](/application/tagging).
## Related logs
The log lines linked to this trace, with their time, severity, and message. In the stroopwafel example, they show the waitlist task starting, the email delivery failing, and the retry that follows. Select **Open in the log view** to continue in the [log explorer](/logging).
The panel reports when it finds no related log lines. AppSignal links a log line to a trace by a shared `request_id` or `trace_id`, so the panel stays empty when the operation logged nothing, when your app does not send logs to AppSignal yet, or when the identifier is missing from one of the two. See [configure logging](/logging/configuration) to send logs, and [link traces with logs](/guides/linking-traces-with-logs) for the identifiers.
## Request details
For web requests, the page also shows the raw data AppSignal received, in three panels:
* **Request headers**: the HTTP headers sent with the request. Use [header filtering](/application/header-filtering) to choose which headers your app sends.
* **Request payload**: the request body, such as a GraphQL query and its variables. Use [parameter filtering](/application/parameter-filtering) to keep sensitive values out.
* **Request session data**: the session values for the request. Use [session data filtering](/application/session-data-filtering) to keep sensitive values out.
## Performance trends
A chart of the action's performance over the last 24 hours or 30 days.
## Triggers
Triggers alert you when this action gets slow. The panel lists the triggers that already exist for the action, such as `Mean > 200 ms`.
Select **Add new** to open the trigger form with the namespace and action name filled in. In the form, you:
* Choose the value to alert on, such as the mean, and the threshold above which AppSignal alerts, such as 200 ms.
* Set an alert warm-up and an alert cooldown in minutes.
* Add a description for the people who receive the alert.
* Select the notifiers that receive it, such as email, Slack, PagerDuty, or OpsGenie.
For how alerts open, close, and repeat, see [anomaly detection](/anomaly-detection) and [warm-up and cooldown](/anomaly-detection#warm-up-and-cooldown).
## Actions
* **Time Detective**: review your application's data as it was at the time of the trace.
* **Send to your issue tracker**: create an issue from the trace. This action appears when a tracker is connected, and its label matches that tracker, such as GitHub, GitLab, Jira, or Linear. See [integrations](/application/integrations).
## Traces
The Traces panel lists the other stored traces for this action, each with its timestamp and duration. Select any of them to open that trace.
To find a specific trace:
* Enter a value in the tag filter field, or use the **Filter** action on a tag, to keep only the traces that carry that value.
* Open the date control to pick a date and time, or choose **Today**, **Yesterday**, **Last week**, or **Latest**. Select **Jump to latest** to return to the most recent traces.
* Select **Load newer traces** or **Load older traces** to move through the list.
* Select **Reset** to clear the filters and see every stored trace again.
A [deploy marker](/application/markers) between two traces shows where a new revision took over, which helps you compare traces from before and after a deploy.
AppSignal does not store a trace for every request. It stores a representative set instead, so the list shows a sample of the action's traffic.