This feature requires{" "}
{v.name} version {v.version}
{getBoundText(v.bound)}.
 ### Error tracking
Track exceptions that occur when running Sidekiq jobs.
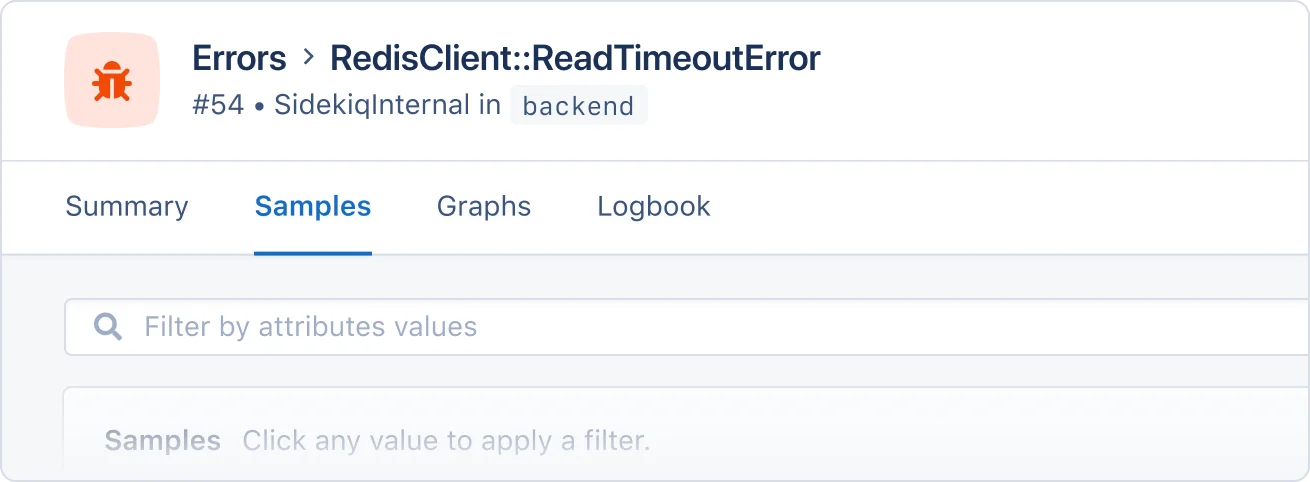
When Sidekiq encounters a problem before or after a job has been processed, such as parsing JSON from Redis, it will raise an error. This error is reported under the SidekiqInternal action on the background namespace, as the job context is unknown when the error occurs.
### Error tracking
Track exceptions that occur when running Sidekiq jobs.
When Sidekiq encounters a problem before or after a job has been processed, such as parsing JSON from Redis, it will raise an error. This error is reported under the SidekiqInternal action on the background namespace, as the job context is unknown when the error occurs.
 #### Report errors on job discard
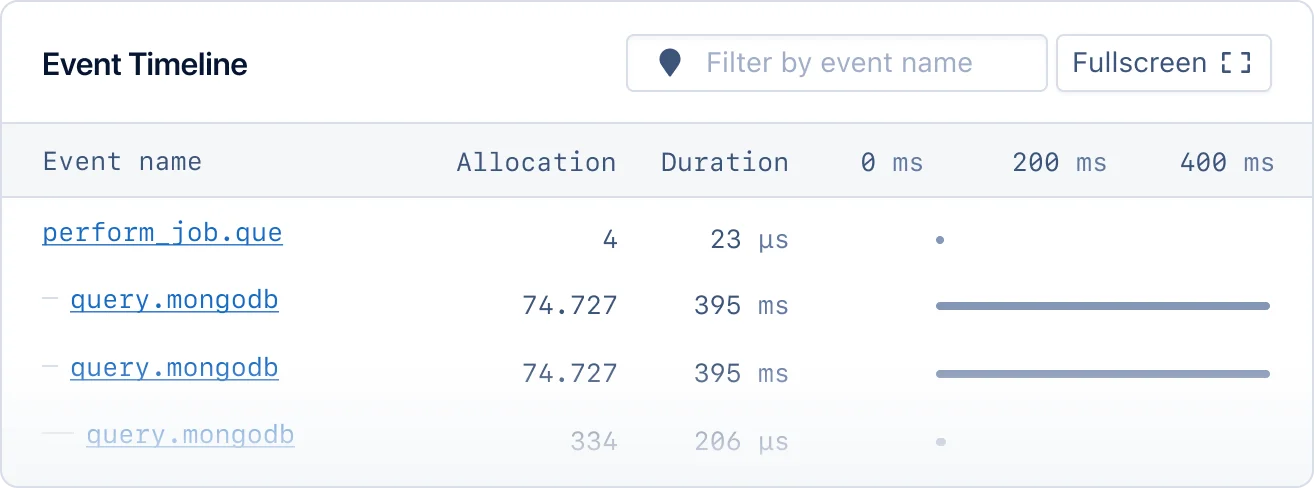
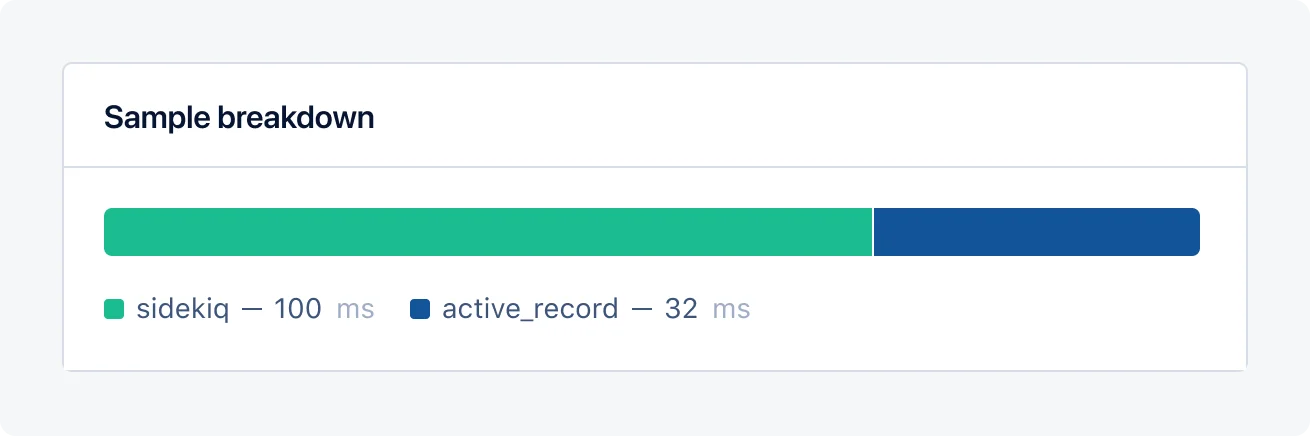
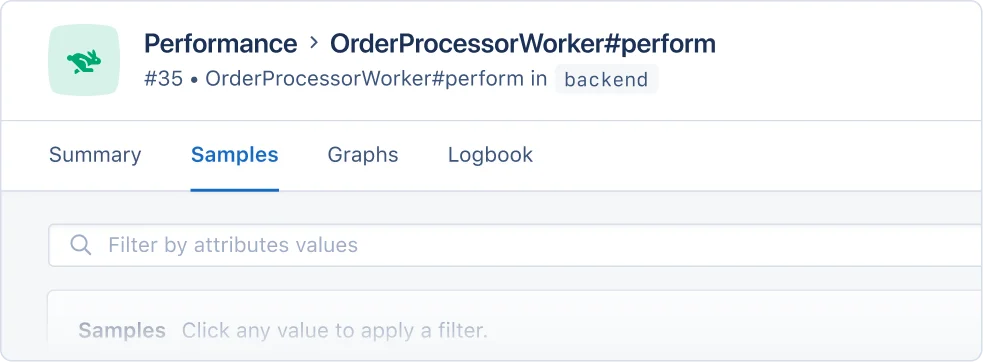 ### Sample performance
Sample breakdowns allow you to review Sidekiq's performance quickly and spot performance problems without having to dive deep into the details.
### Sample performance
Sample breakdowns allow you to review Sidekiq's performance quickly and spot performance problems without having to dive deep into the details.
 ## Magic dashboard
When AppSignal receives Sidekiq metrics, it will create a Sidekiq magic dashboard, available from the dashboard section of the AppSignal app.
The Sidekiq magic dashboard will have the following graphs:
| Graph | Metrics | Tags |
| ------------------------------------------------------ | ------------------------------------------------------------------ | ------------------------------------- |
| [Connection count](#connection-count-graph) | `sidekiq_connection_count` | `hostname` |
| [Duration per worker](#duration-per-worker-graph) | `transaction_duration` |
## Magic dashboard
When AppSignal receives Sidekiq metrics, it will create a Sidekiq magic dashboard, available from the dashboard section of the AppSignal app.
The Sidekiq magic dashboard will have the following graphs:
| Graph | Metrics | Tags |
| ------------------------------------------------------ | ------------------------------------------------------------------ | ------------------------------------- |
| [Connection count](#connection-count-graph) | `sidekiq_connection_count` | `hostname` |
| [Duration per worker](#duration-per-worker-graph) | `transaction_duration` | 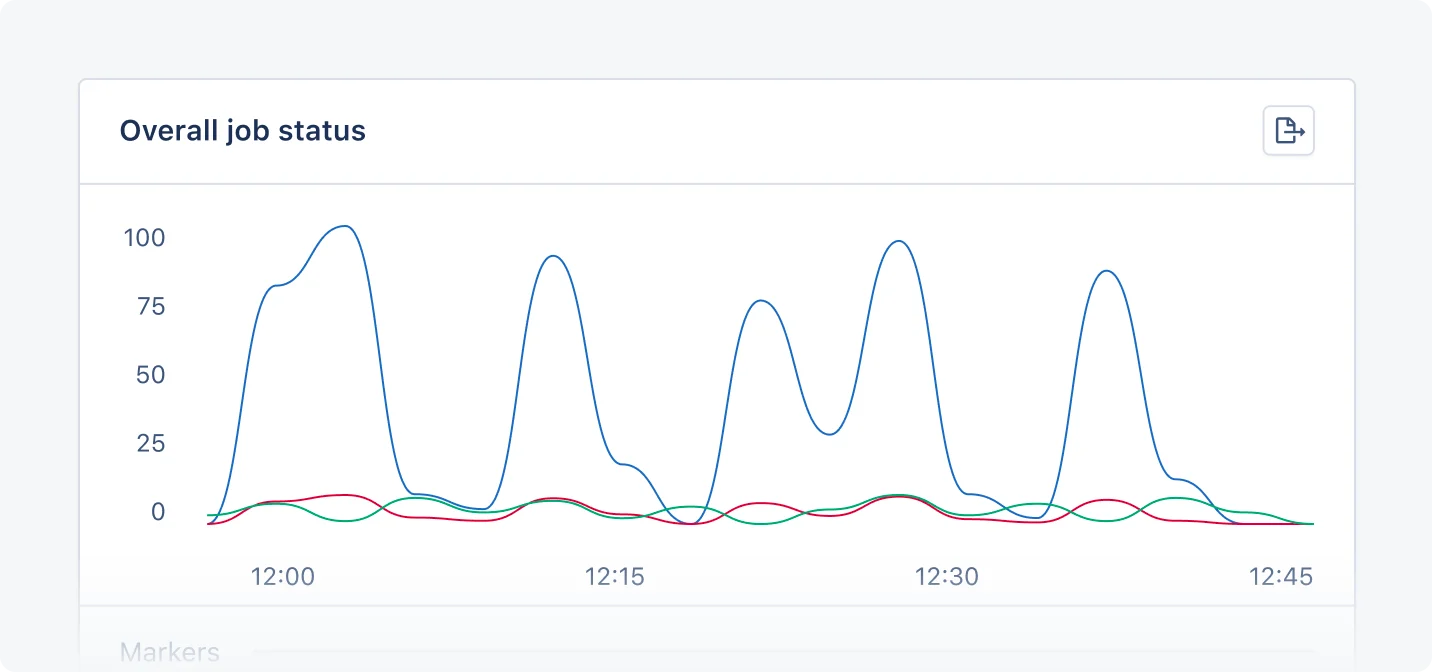 ### Connection count graph
The Connection count graph shows the count of Sidekiq connections per host.
You can use the Connection count graph to monitor Sidekiq connections per host, spot connection trends and bottlenecks, and optimize resources.
### Duration per worker graph
The Duration per worker graph shows the amount of time that it took for jobs to execute, grouped by namespace and action.
You can use the Duration per worker graph to monitor the performance of workers per action and namespace, giving you a helicopter view of Sidekiq performance and allowing you to quickly identify and investigate spikes in duration time.
### Job status per queue graph
The job status per queue with a priority graph shows the number of jobs that were executed, grouped by their resulting status, by the queue in which they were queued.
You can use the Job status per queue graph to monitor job error counts and performance based on queue, identify bottlenecks, and optimize your background jobs for scalability.
### Overall job status graph
The overall job status graph shows the number of expected Sidekiq jobs per status and namespace.
You can use the Overall job status graph to monitor failed jobs and track job distribution across namespaces.
### Queue latency graph
The Queue latency graph shows the latency the queue experienced at the time of measurement. [Sidekiq calculates this](https://github.com/mperham/sidekiq/wiki/API) by subtracting the time the last job was enqueued from the time of measurement. This value is reported as milliseconds.
You can use the Queue latency graph to spot delays in processing jobs, detect queue congestion, and understand how quickly background jobs start.
### Queue length graph
The Queue length graph shows the length of Sidekiq queues per queue and namespace.
You can use the Queue length graph to monitor queue performance and spot and solve Sidekiq bottlenecks.
### Redis memory usage graph
The Redis memory usage graph shows:
* The Virtual Memory Size memory usage of Redis (`sidekiq_memory_usage_rss`)
* The Resident Set Size memory usage of Redis (`sidekiq_memory_usage_rss`)
You can use the Redis memory usage graph to monitor Sidekiq's memory usage, improve resource management, and optimize memory-intensive jobs.
### Throughput per worker graph
The Throughput per worker graph shows the number of jobs that were executed, grouped by hostname.
You can use this graph to monitor worker performance, grouped by the class that defines the job.
### Worker/processes count graph
The Worker/processes count graph shows the number of Sidekiq workers and executed processes.
You can use the Worker/processes count graph to manage workload distribution, optimize resource allocation, and identify performance problems.
## Hostname configuration
AppSignal attempts to detect the hostname of the Redis instance your Sidekiq instance uses to store its queues. If the detection is not accurate, it's possible to customize the hostname configuration by overriding the default Sidekiq probe.
First, you'll need to [override the default Sidekiq probe](/ruby/instrumentation/minutely-probes#overriding-default-probes) by registering a new probe with the same name (`:sidekiq`). This probe will need a configuration hash, including the `:hostname` key, with the new hostname value. By specifying the `:hostname` config option in the Sidekiq minutely probe, the metrics will be tagged with the given hostname value. The `:hostname` config option value is not used to establish a Redis or Sidekiq connection.
For example:
### Connection count graph
The Connection count graph shows the count of Sidekiq connections per host.
You can use the Connection count graph to monitor Sidekiq connections per host, spot connection trends and bottlenecks, and optimize resources.
### Duration per worker graph
The Duration per worker graph shows the amount of time that it took for jobs to execute, grouped by namespace and action.
You can use the Duration per worker graph to monitor the performance of workers per action and namespace, giving you a helicopter view of Sidekiq performance and allowing you to quickly identify and investigate spikes in duration time.
### Job status per queue graph
The job status per queue with a priority graph shows the number of jobs that were executed, grouped by their resulting status, by the queue in which they were queued.
You can use the Job status per queue graph to monitor job error counts and performance based on queue, identify bottlenecks, and optimize your background jobs for scalability.
### Overall job status graph
The overall job status graph shows the number of expected Sidekiq jobs per status and namespace.
You can use the Overall job status graph to monitor failed jobs and track job distribution across namespaces.
### Queue latency graph
The Queue latency graph shows the latency the queue experienced at the time of measurement. [Sidekiq calculates this](https://github.com/mperham/sidekiq/wiki/API) by subtracting the time the last job was enqueued from the time of measurement. This value is reported as milliseconds.
You can use the Queue latency graph to spot delays in processing jobs, detect queue congestion, and understand how quickly background jobs start.
### Queue length graph
The Queue length graph shows the length of Sidekiq queues per queue and namespace.
You can use the Queue length graph to monitor queue performance and spot and solve Sidekiq bottlenecks.
### Redis memory usage graph
The Redis memory usage graph shows:
* The Virtual Memory Size memory usage of Redis (`sidekiq_memory_usage_rss`)
* The Resident Set Size memory usage of Redis (`sidekiq_memory_usage_rss`)
You can use the Redis memory usage graph to monitor Sidekiq's memory usage, improve resource management, and optimize memory-intensive jobs.
### Throughput per worker graph
The Throughput per worker graph shows the number of jobs that were executed, grouped by hostname.
You can use this graph to monitor worker performance, grouped by the class that defines the job.
### Worker/processes count graph
The Worker/processes count graph shows the number of Sidekiq workers and executed processes.
You can use the Worker/processes count graph to manage workload distribution, optimize resource allocation, and identify performance problems.
## Hostname configuration
AppSignal attempts to detect the hostname of the Redis instance your Sidekiq instance uses to store its queues. If the detection is not accurate, it's possible to customize the hostname configuration by overriding the default Sidekiq probe.
First, you'll need to [override the default Sidekiq probe](/ruby/instrumentation/minutely-probes#overriding-default-probes) by registering a new probe with the same name (`:sidekiq`). This probe will need a configuration hash, including the `:hostname` key, with the new hostname value. By specifying the `:hostname` config option in the Sidekiq minutely probe, the metrics will be tagged with the given hostname value. The `:hostname` config option value is not used to establish a Redis or Sidekiq connection.
For example: