> ## Documentation Index
> Fetch the complete documentation index at: https://docs.appsignal.com/llms.txt
> Use this file to discover all available pages before exploring further.

# Puma

export const VersionRequirements = ({versions = []}) => {
  if (!Array.isArray(versions) || versions.length === 0) {
    return null;
  }
  const boundaries = {
    upper: " or lower",
    exact: "",
    lower: " or higher"
  };
  const containerStyle = {
    marginTop: "0.5rem",
    marginBottom: "1.5rem"
  };
  const lineStyle = {
    display: "block",
    margin: "0 0 0.35rem 0",
    fontSize: "0.875rem",
    lineHeight: "1.4"
  };
  const pillBaseStyle = {
    display: "inline-block",
    padding: "0.1em 0.4em",
    borderRadius: "0.25rem",
    border: "1px solid",
    fontFamily: "ui-monospace, SFMono-Regular, Menlo, monospace",
    fontSize: "0.85em",
    fontWeight: 500
  };
  const pillColors = {
    "AppSignal for Elixir": {
      background: "#f3e8ff",
      borderColor: "#e9d5ff",
      color: "#9333ea"
    },
    "AppSignal for Front-end": {
      background: "#fef9c3",
      borderColor: "#fde68a",
      color: "#ca8a04"
    },
    "AppSignal for Go": {
      background: "#ccfbf1",
      borderColor: "#99f6e4",
      color: "#0d9488"
    },
    "AppSignal for JavaScript": {
      background: "#fef9c3",
      borderColor: "#fde68a",
      color: "#ca8a04"
    },
    "AppSignal for Node.js": {
      background: "#dcfce7",
      borderColor: "#bbf7d0",
      color: "#16a34a"
    },
    "AppSignal for Python": {
      background: "#dbeafe",
      borderColor: "#bfdbfe",
      color: "#2563eb"
    },
    "AppSignal for Ruby": {
      background: "#fee2e2",
      borderColor: "#fecaca",
      color: "#dc2626"
    },
    "AppSignal for Rust": {
      background: "#ffedd5",
      borderColor: "#fed7aa",
      color: "#ea580c"
    }
  };
  const defaultPillColor = {
    background: "#f4f4f5",
    borderColor: "#e4e4e7",
    color: "#52525b"
  };
  const getPillStyle = name => ({
    ...pillBaseStyle,
    ...pillColors[name] || defaultPillColor
  });
  const getBoundText = bound => {
    return boundaries[bound] || boundaries.lower;
  };
  return <div style={containerStyle}>
      {versions.map((v, i) => <p key={`${v.name}-${v.version}-${v.bound || "lower"}-${i}`} style={lineStyle}>
          This feature requires{" "}
          <code style={getPillStyle(v.name)}>{v.name}</code> version {v.version}
          {getBoundText(v.bound)}.
        </p>)}
    </div>;
};

<VersionRequirements
  versions={[
{ name: "AppSignal for Ruby", version: "3.0.7" },
{ name: "Puma", version: "3.11.4" }
]}
/>

[Puma](http://puma.io/) was built for speed and parallelism. Puma is a small library providing a fast and concurrent HTTP 1.1 server for Ruby web applications.

The AppSignal Ruby gem automatically inserts a listener into the Puma server; no manual setup is required.

## Puma metrics plugin

The AppSignal Puma plugin will [collect metrics about how Puma is operating](#metrics). When AppSignal detects Puma metrics, it will create an [Magic Dashboard](#magic-dashboard), allowing you to monitor core metrics visually.

To enable the metrics collection, add the AppSignal plugin to your Puma configuration:

<CodeGroup>
  ```ruby Ruby theme={null}
  # puma.rb (or config/puma.rb)
  plugin :appsignal
  ```
</CodeGroup>

<Tip>
  The StatsD server bundled with the AppSignal Agent must be active for the Puma
  metrics plugin to work. Make sure [the `enable_statsd` config
  option](/ruby/configuration/options#option-enable_statsd) is not set to
  `false`.
</Tip>

Puma may require additional configuration to load your application's [secrets](#configuration-secrets), which may be necessary for AppSignal to start.

## Usage with `prune_bundler`

If your `puma.rb` file includes `prune_bundler`, you must add AppSignal as a runtime dependency.

<Tip>
  To use Puma with `prune_bundler`, Puma version 4.2.0 or higher is required.
</Tip>

<CodeGroup>
  ```ruby Ruby theme={null}
  # puma.rb (or config/puma.rb)
  prune_bundler

  plugin :appsignal
  extra_runtime_dependencies ["appsignal"]
  ```
</CodeGroup>

## Usage with `preload_app!`

If your `puma.rb` file includes `preload_app!`, some configuration is required to correctly report metrics from [minutely probes](/ruby/instrumentation/minutely-probes). When `preload_app!` is true, the minutely probes are run in the Puma primary process. In the primary process, the probes cannot access the same data that the app running in Puma workers can, reporting inaccurate or no data.

In the Puma `puma.rb` config file, stop the AppSignal minutely probes in the `before_fork` callback to stop the minutely probes in the Puma main process. Then, start the minutely probes in the worker process from the `on_worker_boot` callback.

<CodeGroup>
  ```ruby Ruby theme={null}
  # puma.rb or config/puma.rb

  # When preload_app! is set
  preload_app!


  # Add this before_fork callback to stop the minutely probes in the Puma main process
  before_fork do
    Appsignal::Probes.stop
  end

  # Add this on_worker_boot callback to start the minutely probes in the Puma worker processes
  on_worker_boot do
    Appsignal::Probes.start
  end
  ```
</CodeGroup>

## Secrets

If you use a library such as [Rails](https://guides.rubyonrails.org/security.html#custom-credentials) or [dotenv](https://github.com/bkeepers/dotenv) to manage your app's secrets and configure AppSignal, you will need to load these in your Puma configuration.

AppSignal runs a background process in Puma's main process when using the Puma plugin. The rest of your app is not loaded by default in Puma's main process (unless you use `preload_app!`, which may not be suitable for your app). Without additional configuration, the AppSignal config will fail to load, and AppSignal will not start.

No "on boot" hook is available in Puma to load your extra config in the main process. To load your configuration, add it to the root of your `puma.rb` configuration file, as in the example below.

<CodeGroup>
  ```ruby Ruby theme={null}
  # puma.rb (or config/puma.rb)
  plugin :appsignal # Add this plugin

  # Rails secrets
  # Add this line when using Rails secrets in your `config/appsignal.rb` or `config/appsignal.yml` file.
  require "rails"

  # Add this section when using dotenv for secrets management
  require "dotenv"
  Dotenv.load
  # or for Rails apps:
  require "dotenv/load"
  Dotenv.load


  # Rest of your Puma config...
  ```
</CodeGroup>

### Hostname {/* id: minutely-probe-configuration-hostname */}

This probe listens to the [`APPSIGNAL_HOSTNAME` config option from the environment
variable](/ruby/configuration/options#option-hostname) for the hostname tag
added to all its metrics. If none is set, it will try to detect it automatically.
Use the `APPSIGNAL_HOSTNAME` system environment variable to set the hostname if you
want to change the detected hostname.

### StatsD port

This probe listens to the [`APPSIGNAL_STATSD_PORT` config option from the environment variable](/ruby/configuration/options#option-statsd_port) for the configuration of non-default StatsD ports. If the environment variable is not set, it defaults to 8125. For the Puma main process, it is required to use the environment variable; it will not read the AppSignal file configuration.

## Phased restart {/* id: minutely-probe-phased-restart */}

Puma [phased restarts](https://github.com/puma/puma/blob/master/docs/restart.md)
don't restart the main Puma process, meaning that the AppSignal background process
does not get restarted either on a phased restart. If you have made changes to the
AppSignal config, you will need to fully restart your Puma app afterward to have
the configuration change take effect.

<CodeGroup>
  ```sh Shell theme={null}
  # After changing the AppSignal config, restart using:
  pumactl restart
  # instead of: pumactl phased-restart
  ```
</CodeGroup>

## Magic dashboard

When AppSignal receives Puma metrics, it will create a Puma magic dashboard, available from the dashboard section of the AppSignal app.

The Puma magic dashboard will have the following graphs:

| Graph                                           | Metrics                   | Tags                                            |
| ----------------------------------------------- | ------------------------- | ----------------------------------------------- |
| [Connection backlog](#connection-backlog-graph) | `puma_connection_backlog` | `hostname`                                      |
| [Pool capacity](#pool-capacity-graph)           | `puma_pool_capacity`      | `hostname`                                      |
| [Threads](#threads-graph)                       | `puma_threads`            | <li>`max`</li><li>`running`</li>                |
| [Worker info](#worker-info-graph)               | `puma_workers`            | <li>`booted`</li><li>`count`</li><li>`old`</li> |

Tags give you a contextual breakdown of Active job performance information. AppSignal reports the following tags for Active Job jobs:

| Name       | Description                                                                                                                                    |
| ---------- | ---------------------------------------------------------------------------------------------------------------------------------------------- |
| `booted`   | Total number of currently booted workers for this server.                                                                                      |
| `count`    | Number of currently running threads for this server.                                                                                           |
| `hostname` | Name of the host the metric was reported from.                                                                                                 |
| `max`      | Maximum number of configured threads for this server.                                                                                          |
| `old`      | Number of workers running the previous configuration/code of the server at the moment in time. Puma will phase these out as new workers start. |
| `running`  | Number of currently running threads for this server                                                                                            |

Graphs allow you to monitor your application's metrics visually. You can add markers to graphs and click on any data point to gain insights into your application's state at that time.

<img src="https://mintcdn.com/appsignal-715f5a51/4TRZP0Sq9Zq7PAPW/assets/images/screenshots/ruby/integrations/puma/dashboard-graphs.png?fit=max&auto=format&n=4TRZP0Sq9Zq7PAPW&q=85&s=b9c868a34aedc2a6ee3f1e870c0e97c8" alt="Example Puma magic dashboard" width="1432" height="672" data-path="assets/images/screenshots/ruby/integrations/puma/dashboard-graphs.png" />

### Connection backlog graph

The Connection backlog graph shows the amount of incoming connections to the server that are waiting to be served in the server's backlog queue.

You can use the Connection backlog graph to monitor how many requests are waiting to be handled and spot Puma bottlenecks.
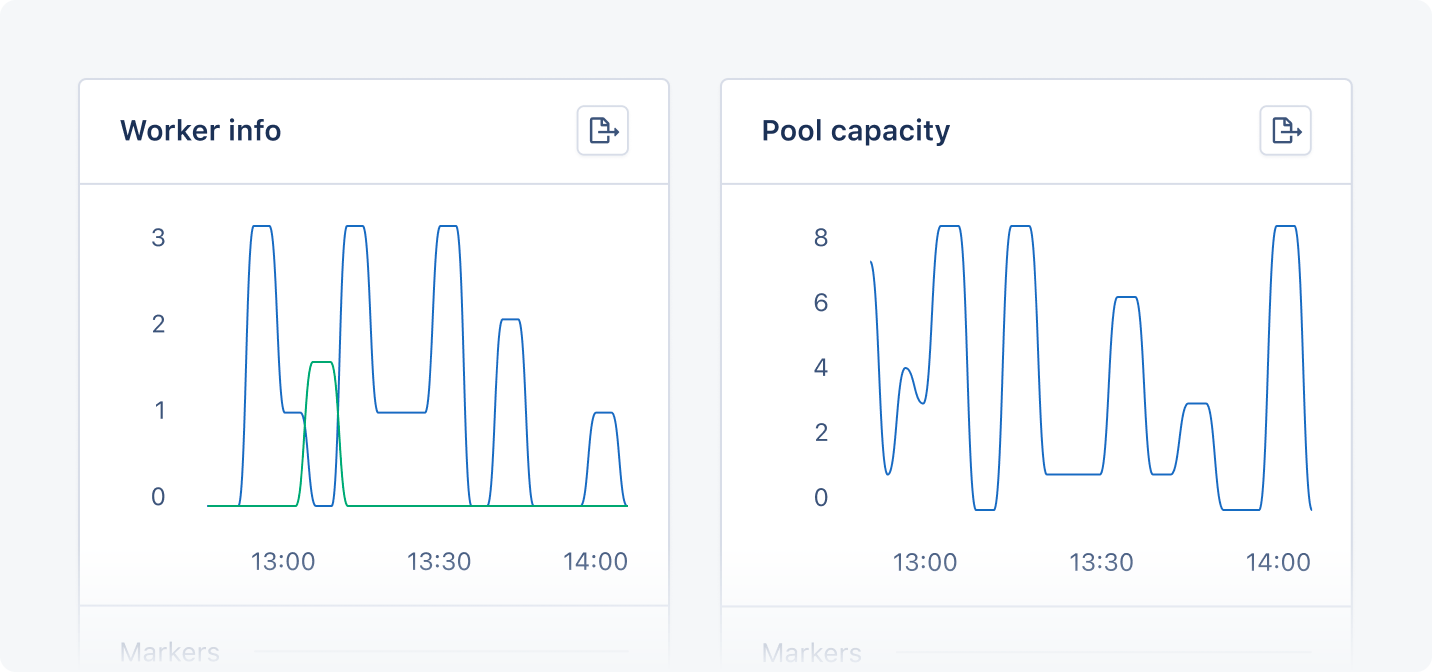
### Pool capacity graph

The Pool capacity graph shows the amount of Puma threads available to receive requests, including Puma threads that have yet to be spawned.

You can use the Pool capacity graph to monitor the availability of Puma threads and optimize workers.

### Threads graph

The Threads graph shows information about the threads spawned by Puma to serve web requests aggregated across all Puma workers. To serve web requests, Puma will spawn more threads when needed. The graph will show you the amount of threads running against the max available number of threads.

You can use the Threads graph to monitor the demand and supply of Puma threads and optimize workers.

### Worker info graph

The Worker info graph shows how many Puma workers are working and what version of your website they are using. The count line shows how many workers are working in total, while the booted and old lines show how many workers are using the new version and how many workers are using the old version of your application.

You can use the worker info graph to monitor the status and performance of your Puma workers and see how many workers are running on an outdated configuration of your application.

[thread pool]: https://github.com/puma/puma/#thread-pool

[clustered mode]: https://github.com/puma/puma/#clustered-mode
