> ## Documentation Index
> Fetch the complete documentation index at: https://docs.appsignal.com/llms.txt
> Use this file to discover all available pages before exploring further.

# Global VM Lock

export const VersionRequirements = ({versions = []}) => {
  if (!Array.isArray(versions) || versions.length === 0) {
    return null;
  }
  const boundaries = {
    upper: " or lower",
    exact: "",
    lower: " or higher"
  };
  const containerStyle = {
    marginTop: "0.5rem",
    marginBottom: "1.5rem"
  };
  const lineStyle = {
    display: "block",
    margin: "0 0 0.35rem 0",
    fontSize: "0.875rem",
    lineHeight: "1.4"
  };
  const pillBaseStyle = {
    display: "inline-block",
    padding: "0.1em 0.4em",
    borderRadius: "0.25rem",
    border: "1px solid",
    fontFamily: "ui-monospace, SFMono-Regular, Menlo, monospace",
    fontSize: "0.85em",
    fontWeight: 500
  };
  const pillColors = {
    "AppSignal for Elixir": {
      background: "#f3e8ff",
      borderColor: "#e9d5ff",
      color: "#9333ea"
    },
    "AppSignal for Front-end": {
      background: "#fef9c3",
      borderColor: "#fde68a",
      color: "#ca8a04"
    },
    "AppSignal for Go": {
      background: "#ccfbf1",
      borderColor: "#99f6e4",
      color: "#0d9488"
    },
    "AppSignal for JavaScript": {
      background: "#fef9c3",
      borderColor: "#fde68a",
      color: "#ca8a04"
    },
    "AppSignal for Node.js": {
      background: "#dcfce7",
      borderColor: "#bbf7d0",
      color: "#16a34a"
    },
    "AppSignal for Python": {
      background: "#dbeafe",
      borderColor: "#bfdbfe",
      color: "#2563eb"
    },
    "AppSignal for Ruby": {
      background: "#fee2e2",
      borderColor: "#fecaca",
      color: "#dc2626"
    },
    "AppSignal for Rust": {
      background: "#ffedd5",
      borderColor: "#fed7aa",
      color: "#ea580c"
    }
  };
  const defaultPillColor = {
    background: "#f4f4f5",
    borderColor: "#e4e4e7",
    color: "#52525b"
  };
  const getPillStyle = name => ({
    ...pillBaseStyle,
    ...pillColors[name] || defaultPillColor
  });
  const getBoundText = bound => {
    return boundaries[bound] || boundaries.lower;
  };
  return <div style={containerStyle}>
      {versions.map((v, i) => <p key={`${v.name}-${v.version}-${v.bound || "lower"}-${i}`} style={lineStyle}>
          This feature requires{" "}
          <code style={getPillStyle(v.name)}>{v.name}</code> version {v.version}
          {getBoundText(v.bound)}.
        </p>)}
    </div>;
};

<VersionRequirements
  versions={[
{ name: "AppSignal for Ruby", version: "3.3.9" },
{ name: "Ruby", version: "3.2" },
{ name: "gvltools", version: "0.2" }
]}
/>

The Ruby VM (Virtual Machine) schedules Ruby threads for execution. At any given point, only one thread at a time can be active and interact with the state of the Ruby VM.

The mechanism by which the Ruby interpreter ensures this is the Global VM Lock (GVL).

Switching between threads has an overhead of its own. The metrics on the Global VM Lock allow you to see the time a thread spends waiting for its turn to run, and the number of threads awaiting execution at a given time. These metrics can provide helpful insights for understanding performance issues in your application.

When AppSignal detects Global VM Lock metrics, it will create an [Magic Dashboard](#magic-dashboard), allowing you to monitor core metrics visually.

## Installation

<Warning>
  The `gvltools` library is only compatible with the official Ruby interpreter.
  JRuby is not supported.
</Warning>

For AppSignal to be able to obtain Global VM Lock metrics, you must add the `gvltools` library to your project:

<CodeGroup>
  ```shell Shell theme={null}
  bundle add gvltools
  ```
</CodeGroup>

Once installed, the AppSignal integration will automatically collect Global VM Lock metrics every minute.

## Magic dashboards

Magic dashboards will appear in the [Dashboard](https://appsignal.com/redirect-to/app?to=dashboard) section of AppSignal.

<img src="https://mintcdn.com/appsignal-715f5a51/4TRZP0Sq9Zq7PAPW/assets/images/screenshots/ruby/integrations/global-vm-lock/magic-dashboard.png?fit=max&auto=format&n=4TRZP0Sq9Zq7PAPW&q=85&s=005c856a34ea7513ae781ce685cb6c45" alt="Ruby GVL magic dashboard creation" width="2548" height="1430" data-path="assets/images/screenshots/ruby/integrations/global-vm-lock/magic-dashboard.png" />

The Global VM Lock magic dashboard has the following graphs:

| Graph                                     | Metric                |
| ----------------------------------------- | --------------------- |
| [Global timer](#global-timer-graph)       | `gvl_global_timer`    |
| [Waiting threads](#waiting-threads-graph) | `gvl_waiting_threads` |

AppSignal reports the following tags for Global VM Lock metrics:

| Name           | Description                                               |
| -------------- | --------------------------------------------------------- |
| `hostname`     | The name of the host that the metric was reported from    |
| `process_id`   | The ID of the process that the metric was reported from   |
| `process_name` | The name of the process that the metric was reported from |
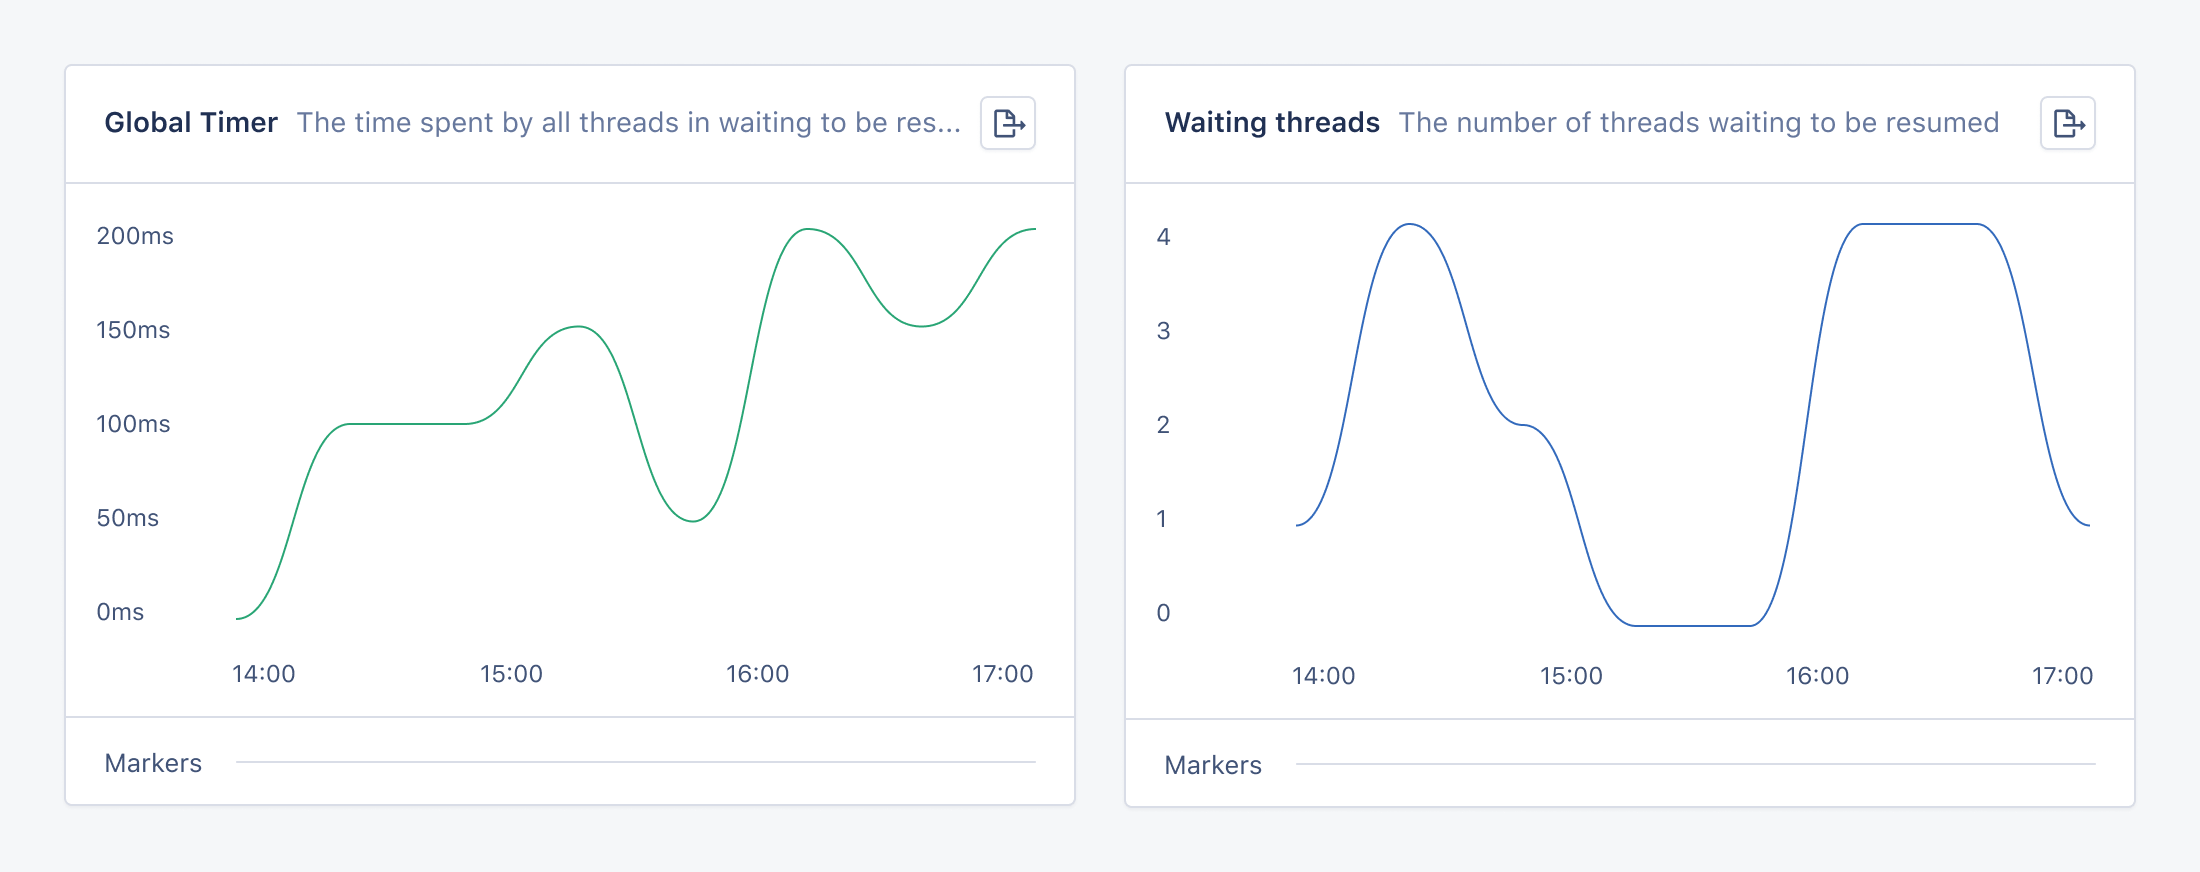
<Tip>
  The `process_id` and `process_name` tags are only reported when using
  AppSignal for Ruby version 3.9.3 or newer.
</Tip>

<img src="https://mintcdn.com/appsignal-715f5a51/4TRZP0Sq9Zq7PAPW/assets/images/screenshots/ruby/integrations/global-vm-lock/dashboard-graphs.png?fit=max&auto=format&n=4TRZP0Sq9Zq7PAPW&q=85&s=7adb9334fbf51a1ab2d6e28aad0c5d3f" alt="Ruby GVL magic dashboard" width="2200" height="872" data-path="assets/images/screenshots/ruby/integrations/global-vm-lock/dashboard-graphs.png" />

### Global timer graph

The global timer graph shows the time that threads spent waiting to be resumed during the last minute, that is, waiting for their code to be executed again.

#### Configuring global timer measurement

Measuring the global timer has an estimated performance overhead of 5%.

To prevent negative impacts on your application's performance, you may want to disable `gvl_global_timer` by default and enable it when needed for specific requests or thread-intensive jobs.

To disable this metric at start time, set [the `enable_gvl_global_timer` configuration option](/ruby/configuration/options#option-enable_gvl_global_timer) to `false`.

Then, you can use the `gvltools` library to enable and disable the global timer measurement without having to restart your application:

<CodeGroup>
  ```ruby Ruby theme={null}
  require "gvltools"

  GVLTools::GlobalTimer.enable

  # some code that uses threads ...

  GVLTools::GlobalTimer.disable
  ```
</CodeGroup>

### Waiting threads graph

The waiting threads graph shows the number of threads waiting to be resumed at any given time. The graph does not include threads that are not ready to be resumed, such as threads that are sleeping or awaiting an I/O event.

To disable this metric, you can set [the `enable_gvl_waiting_threads` configuration option](/ruby/configuration/options#option-enable_gvl_waiting_threads) to `false`.
