> ## Documentation Index
> Fetch the complete documentation index at: https://docs.appsignal.com/llms.txt
> Use this file to discover all available pages before exploring further.
# Render dashboards
> Learn what each automated Render dashboard means.
**Tip:** Make sure you have completed the [Render setup](/render/setup)
and have a working Metrics Stream destination before continuing with this
section.
Once a Metrics Stream is set up, these dashboards are generated automatically as Magic dashboards. No further action is required. Depending on the Render services your workspace uses, you may see:
* [HTTP dashboard](#http-dashboard)
* [Postgres dashboard](#postgres-dashboard)
* [Key Value dashboard](#key-value-dashboard)
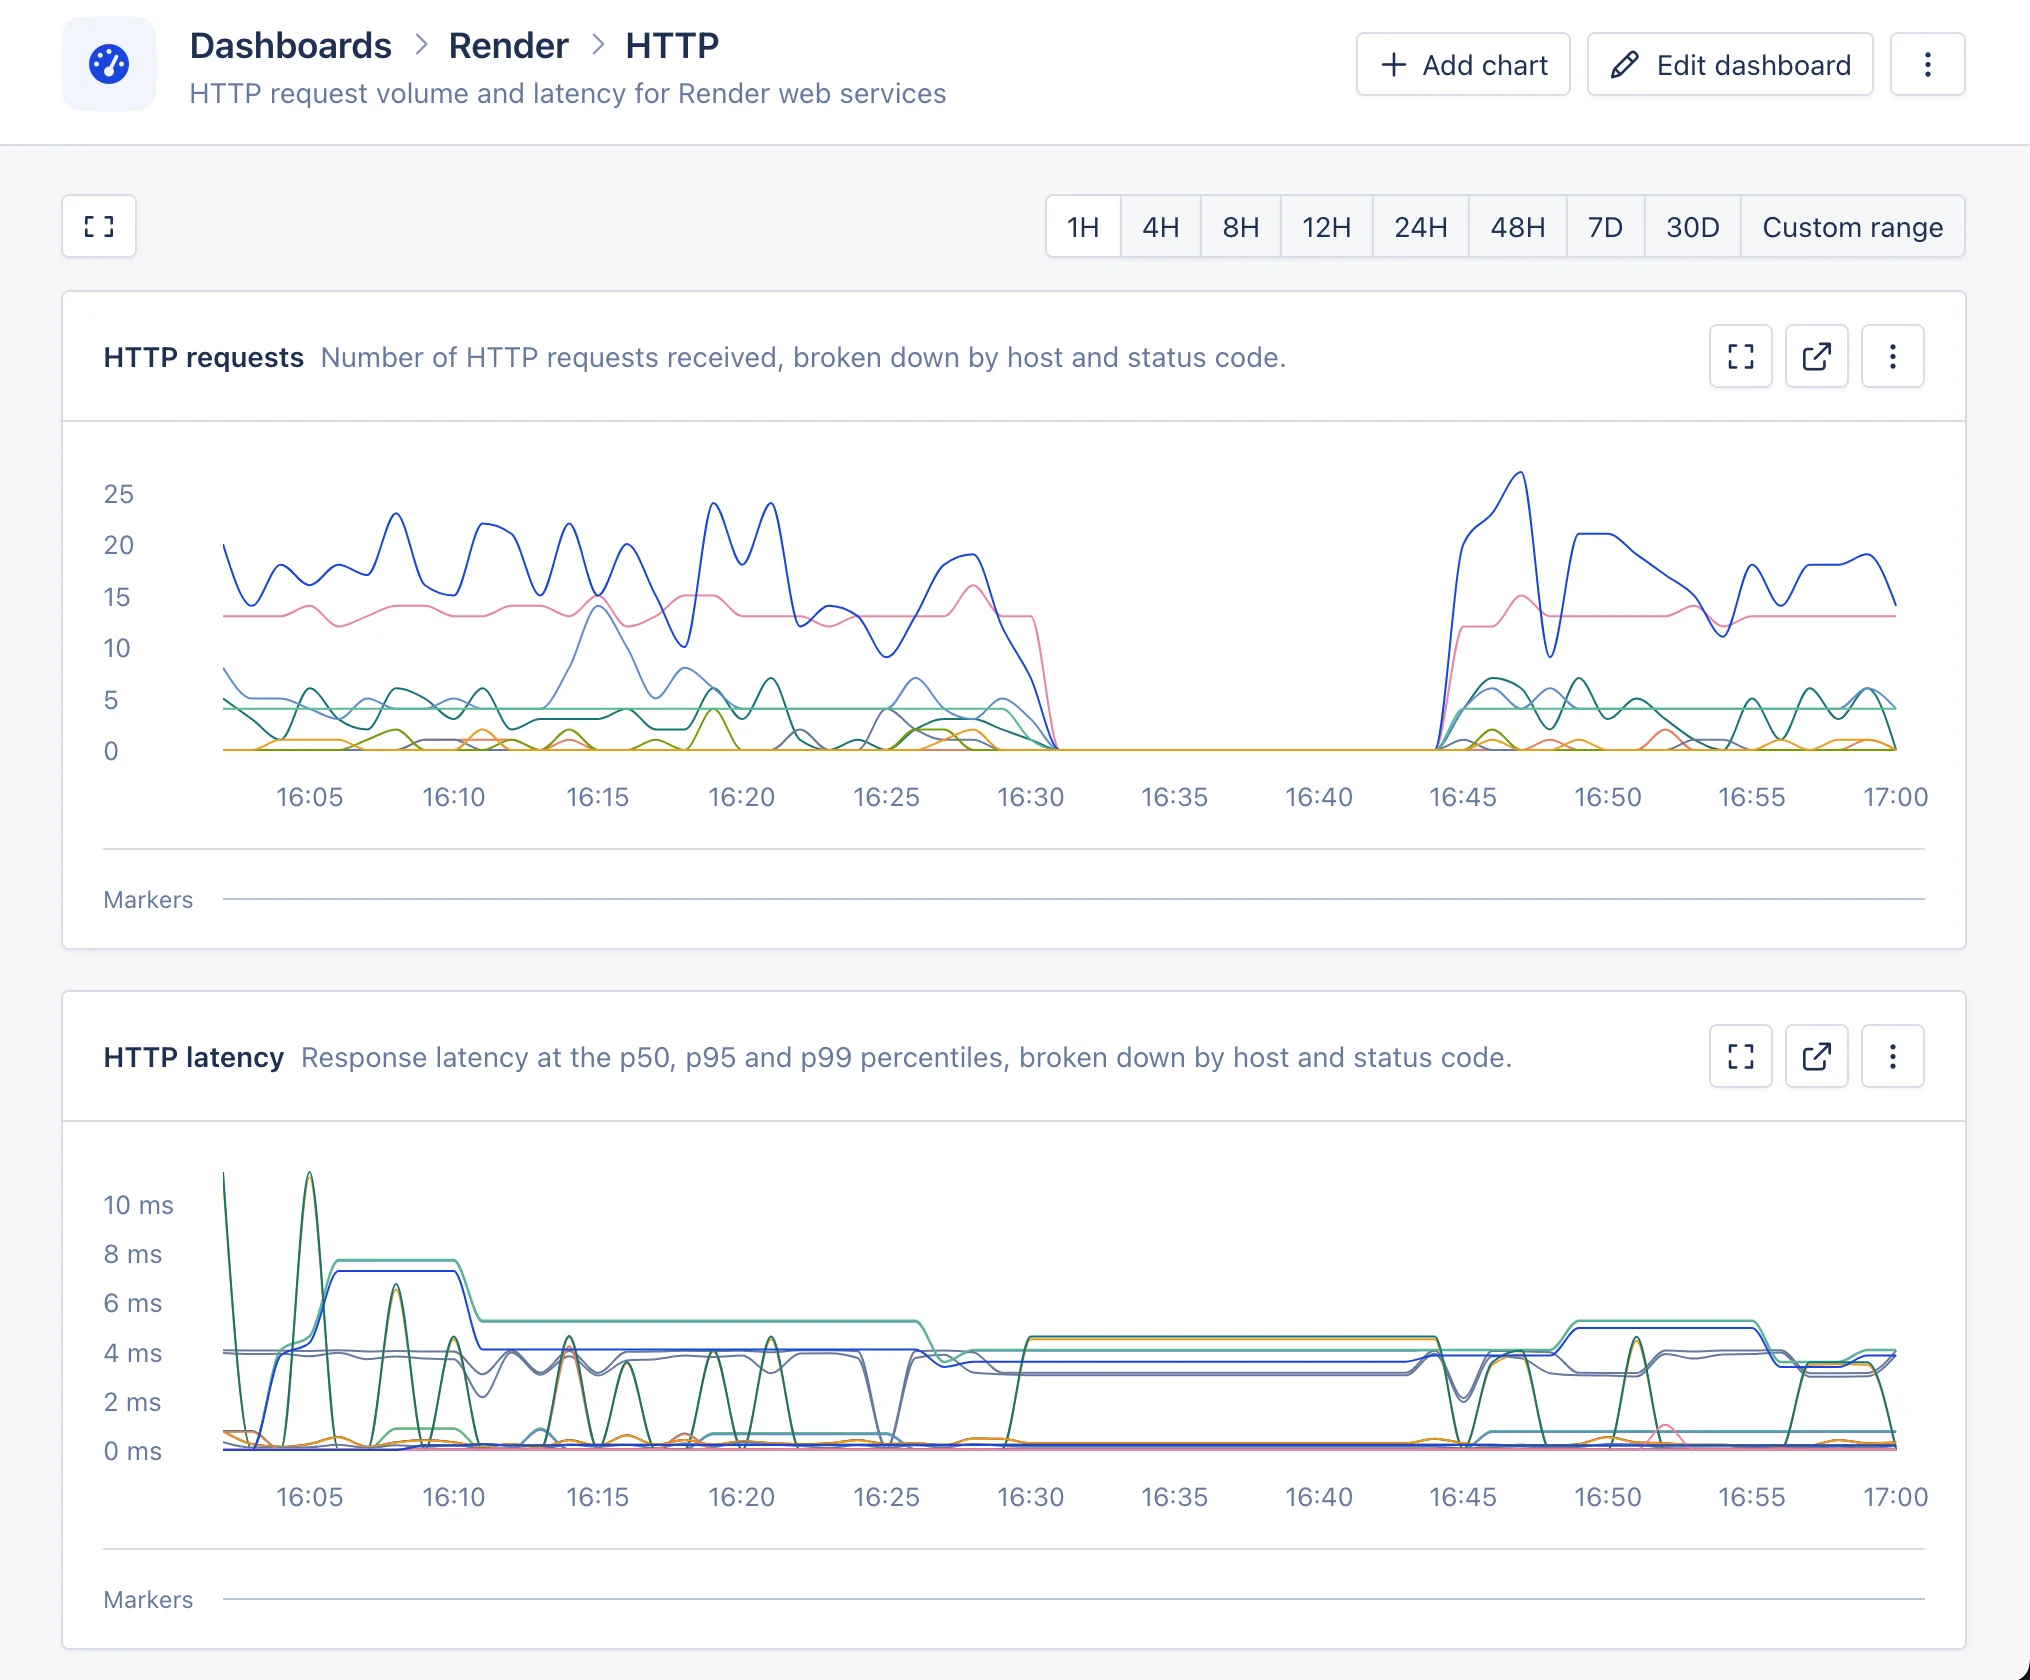
## HTTP dashboard
The HTTP dashboard shows request volume and latency for Render web services. Render aggregates these metrics across all instances of a service, so each line corresponds to a host and status code combination across the whole service rather than a specific replica.
**HTTP requests**: Number of HTTP requests received, broken down by host and status code. It uses the following metric: `render.service.http.requests.total`.
**HTTP latency**: Response latency at the p50, p95 and p99 percentiles, broken down by host and status code. It uses the following metric: `render.service.http.requests.latency`.
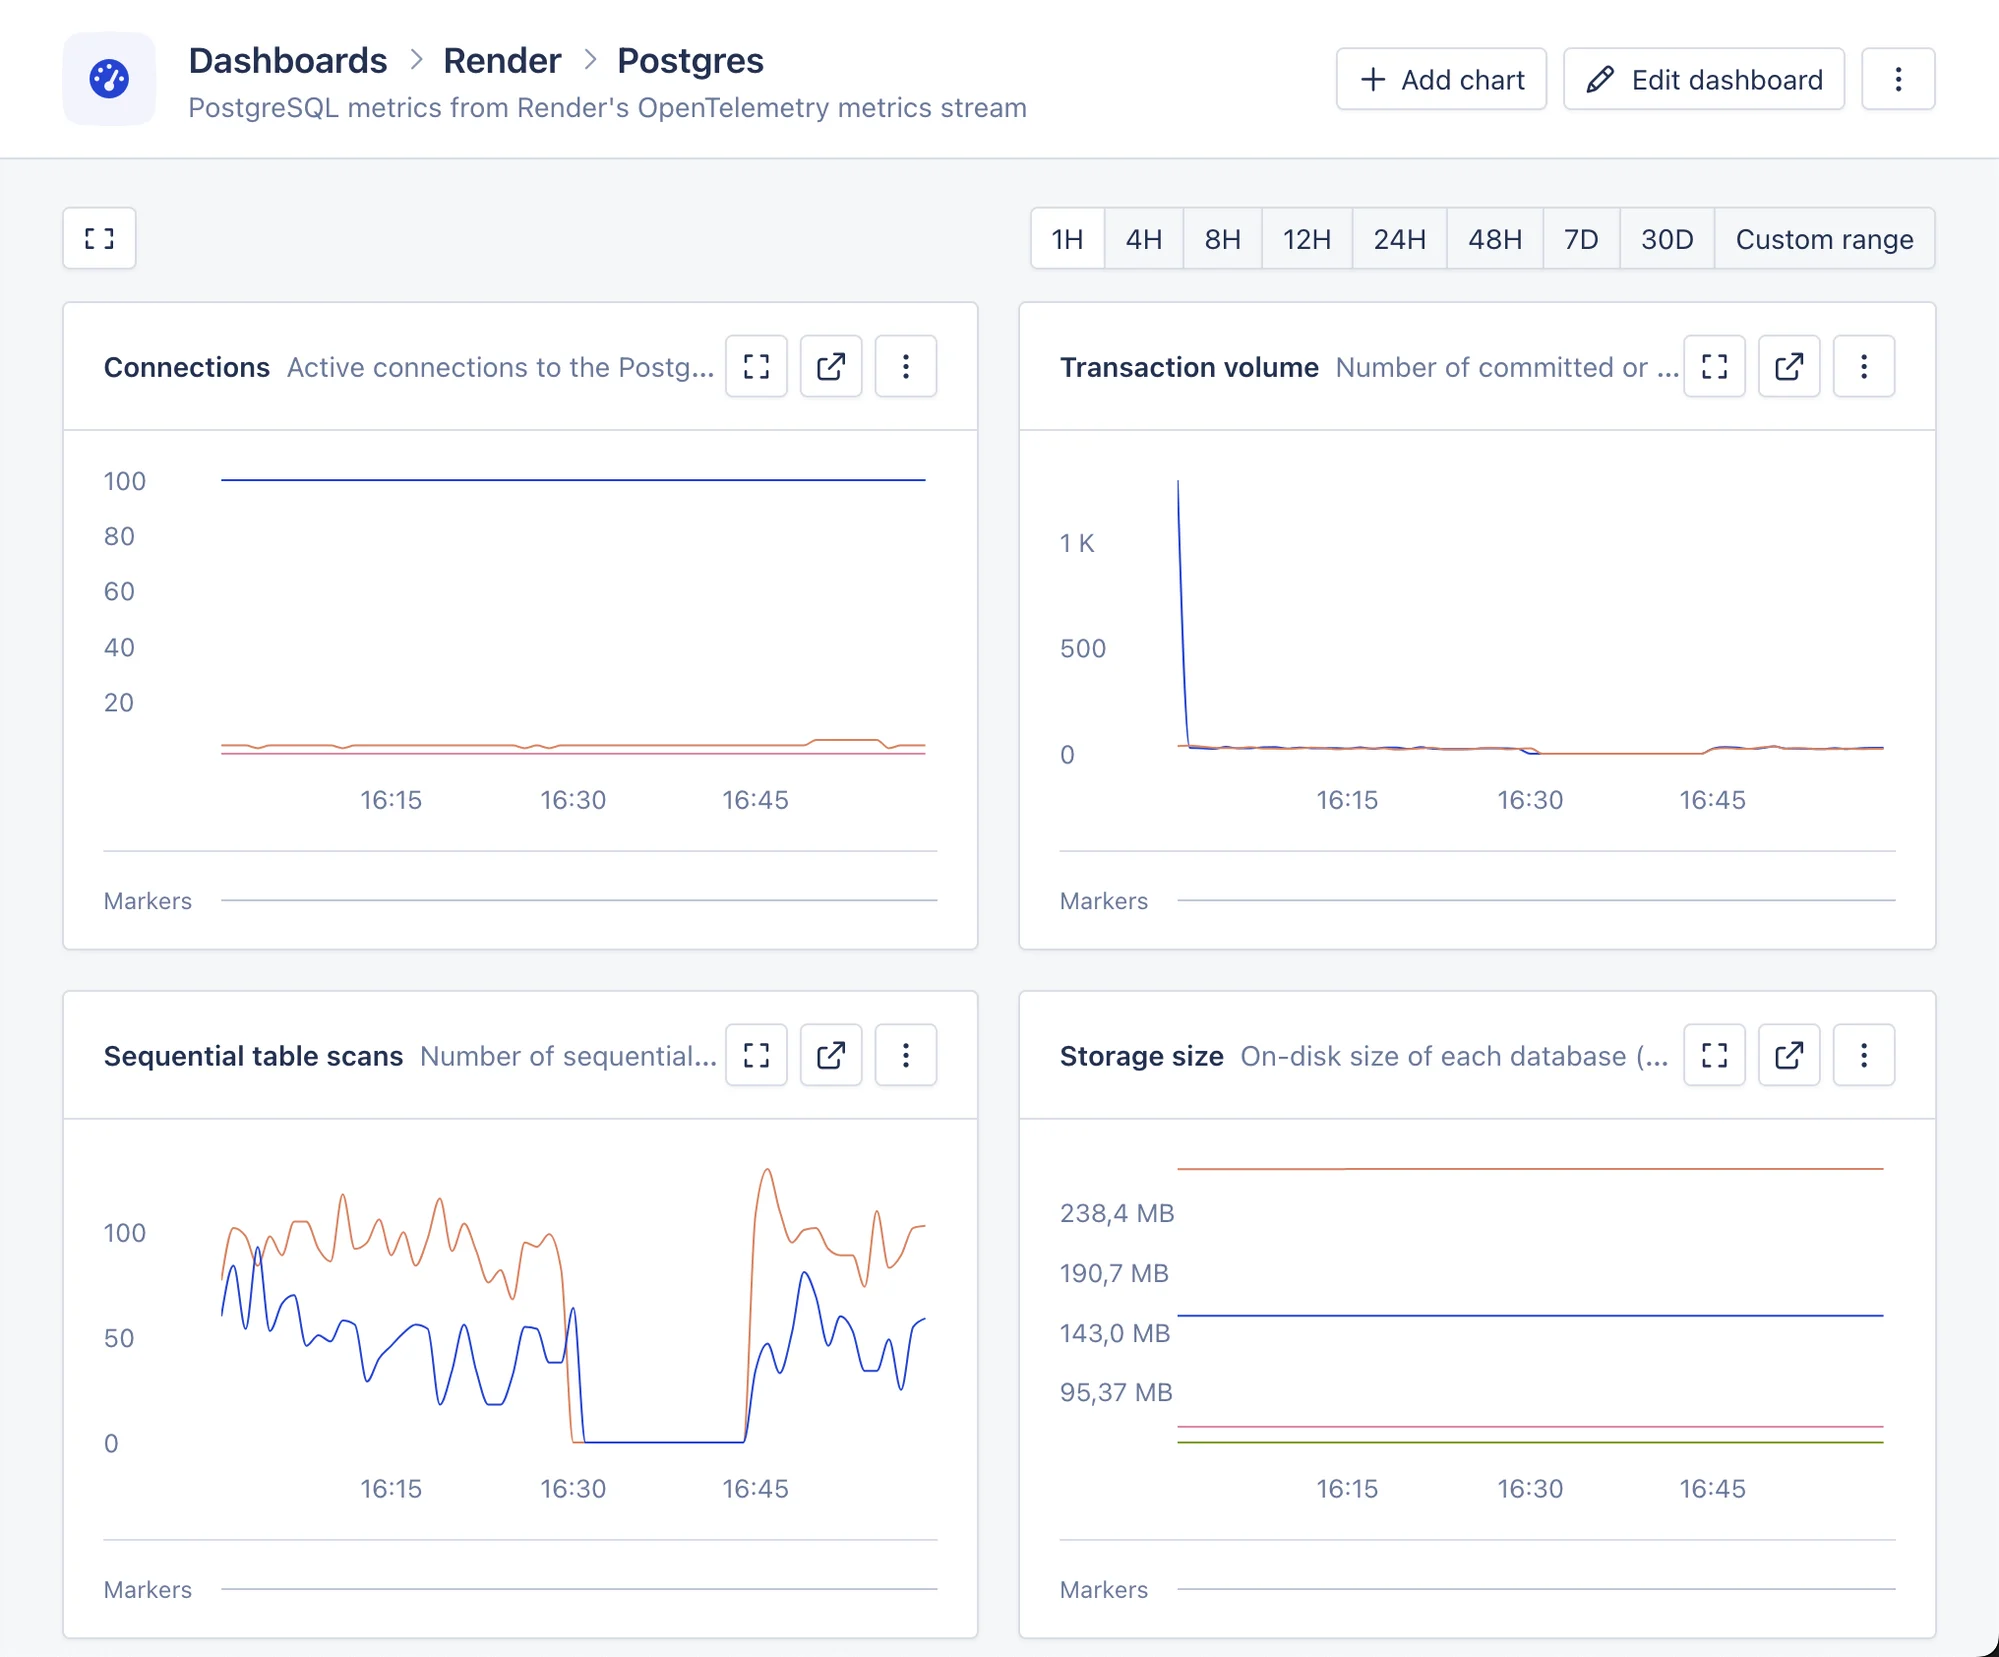
 ## Postgres dashboard
The Postgres dashboard shows information about [Render Postgres](https://render.com/docs/postgresql) instances connected to your workspace.
**Connections**: Active connections per database, compared against the connection limit. It uses the following metrics: `render.postgres.connections` and `render.postgres.connection.limit`.
**Storage size**: Database size and indexes size per database. It uses the following metrics: `render.postgres.database.size` and `render.postgres.indexes.size`.
**Transaction volume**: Number of transactions over time. It uses the following metric: `render.postgres.transaction.volume`.
**Sequential table scans**: Sequential scans per database. A high number of sequential scans can indicate missing indexes. It uses the following metric: `render.postgres.table.scans`.
**Transaction exhaustion**: Per-database transaction ID exhaustion, useful for monitoring vacuuming health. It uses the following metric: `render.postgres.transaction.exhaustion`.
**Slow locks**: Number of locks that exceeded the slow threshold. It uses the following metric: `render.postgres.slow.lock.count`.
**Slow lock wait time**: Time spent waiting on slow locks. It uses the following metric: `render.postgres.slow.lock.time`.
**Replication lag**: Replication delay per replica host. It uses the following metrics: `render.postgres.replication.lag` and `render.postgres.replication.apply.lag`.
## Postgres dashboard
The Postgres dashboard shows information about [Render Postgres](https://render.com/docs/postgresql) instances connected to your workspace.
**Connections**: Active connections per database, compared against the connection limit. It uses the following metrics: `render.postgres.connections` and `render.postgres.connection.limit`.
**Storage size**: Database size and indexes size per database. It uses the following metrics: `render.postgres.database.size` and `render.postgres.indexes.size`.
**Transaction volume**: Number of transactions over time. It uses the following metric: `render.postgres.transaction.volume`.
**Sequential table scans**: Sequential scans per database. A high number of sequential scans can indicate missing indexes. It uses the following metric: `render.postgres.table.scans`.
**Transaction exhaustion**: Per-database transaction ID exhaustion, useful for monitoring vacuuming health. It uses the following metric: `render.postgres.transaction.exhaustion`.
**Slow locks**: Number of locks that exceeded the slow threshold. It uses the following metric: `render.postgres.slow.lock.count`.
**Slow lock wait time**: Time spent waiting on slow locks. It uses the following metric: `render.postgres.slow.lock.time`.
**Replication lag**: Replication delay per replica host. It uses the following metrics: `render.postgres.replication.lag` and `render.postgres.replication.apply.lag`.
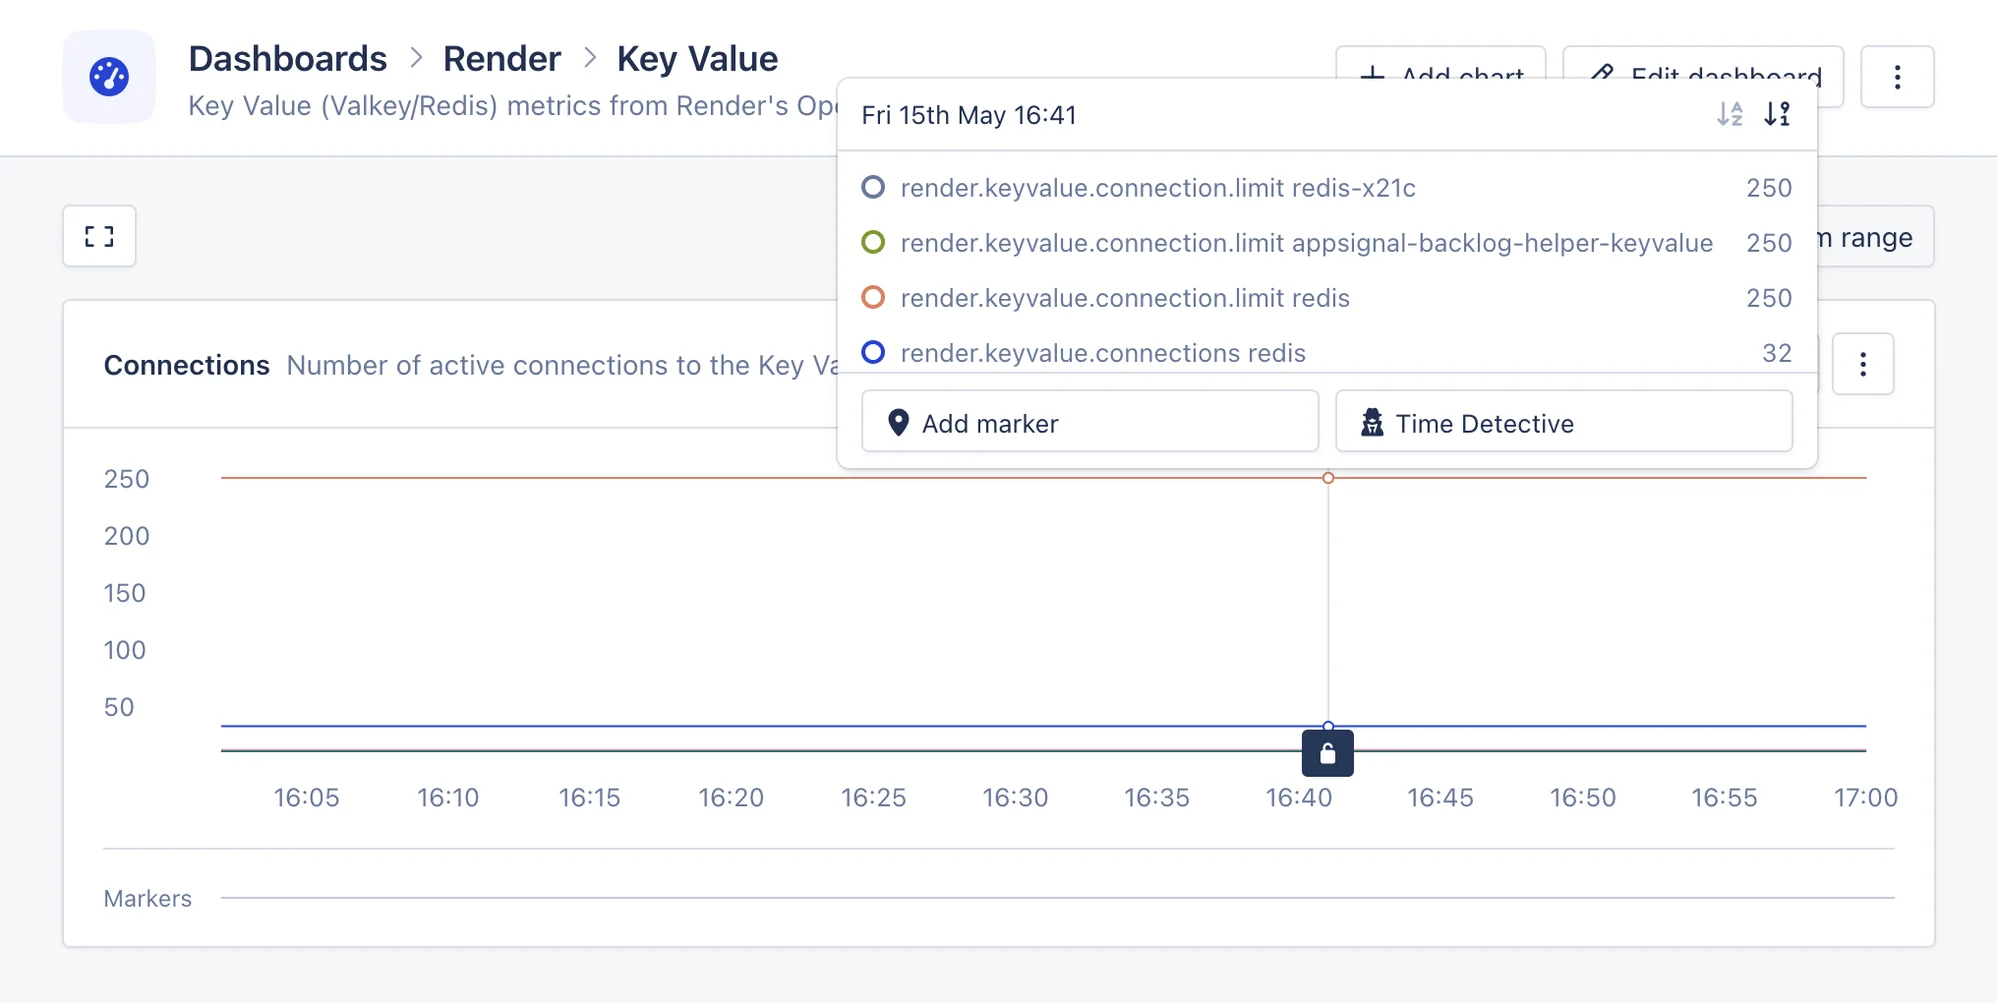
 ## Key Value dashboard
The Key Value dashboard shows connection metrics for [Render Key Value](https://render.com/docs/key-value) (Valkey/Redis) services.
**Connections**: Active connections, compared against the connection limit. It uses the following metrics: `render.keyvalue.connections` and `render.keyvalue.connection.limit`.
CPU, memory, disk and network usage for Key Value services are reported as host metrics and appear in the ["host metrics" section](https://appsignal.com/redirect-to/app?to=host_metrics) instead of on this dashboard.
## Key Value dashboard
The Key Value dashboard shows connection metrics for [Render Key Value](https://render.com/docs/key-value) (Valkey/Redis) services.
**Connections**: Active connections, compared against the connection limit. It uses the following metrics: `render.keyvalue.connections` and `render.keyvalue.connection.limit`.
CPU, memory, disk and network usage for Key Value services are reported as host metrics and appear in the ["host metrics" section](https://appsignal.com/redirect-to/app?to=host_metrics) instead of on this dashboard.