This feature requires{" "}
{v.name} version {v.version}
{getBoundText(v.bound)}.
 ### Sample-overzicht
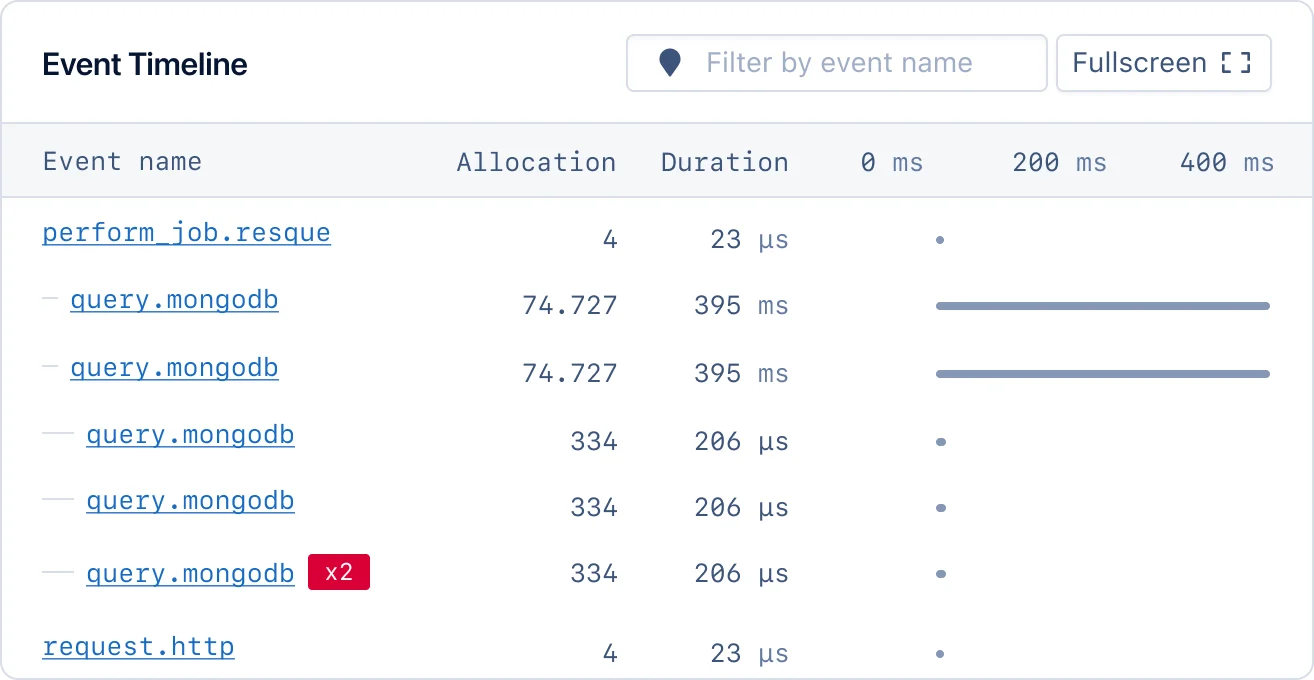
Met sample-overzichten kunt u in één oogopslag MongoDB-prestaties bekijken, waardoor u snel prestatieproblemen kunt opsporen zonder diep in de details te hoeven duiken.
### Sample-overzicht
Met sample-overzichten kunt u in één oogopslag MongoDB-prestaties bekijken, waardoor u snel prestatieproblemen kunt opsporen zonder diep in de details te hoeven duiken.
 ### Slow queries
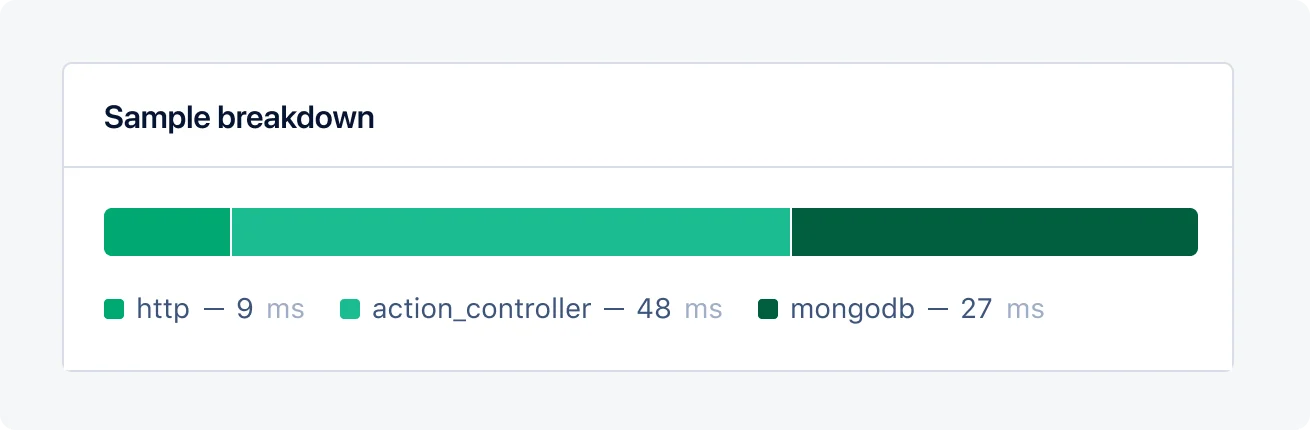
AppSignal heeft een hele suite aan tools om u te helpen de prestaties van uw applicatie te verbeteren. Slow queries is een eenvoudig en informatief overzicht van de trage queries van uw applicatie en de impact die deze hebben op de prestaties van uw applicatie, waardoor u snel en met vertrouwen kunt beslissen welke stappen nodig zijn om ze te optimaliseren.
### Slow queries
AppSignal heeft een hele suite aan tools om u te helpen de prestaties van uw applicatie te verbeteren. Slow queries is een eenvoudig en informatief overzicht van de trage queries van uw applicatie en de impact die deze hebben op de prestaties van uw applicatie, waardoor u snel en met vertrouwen kunt beslissen welke stappen nodig zijn om ze te optimaliseren.
 ## Magic dashboard
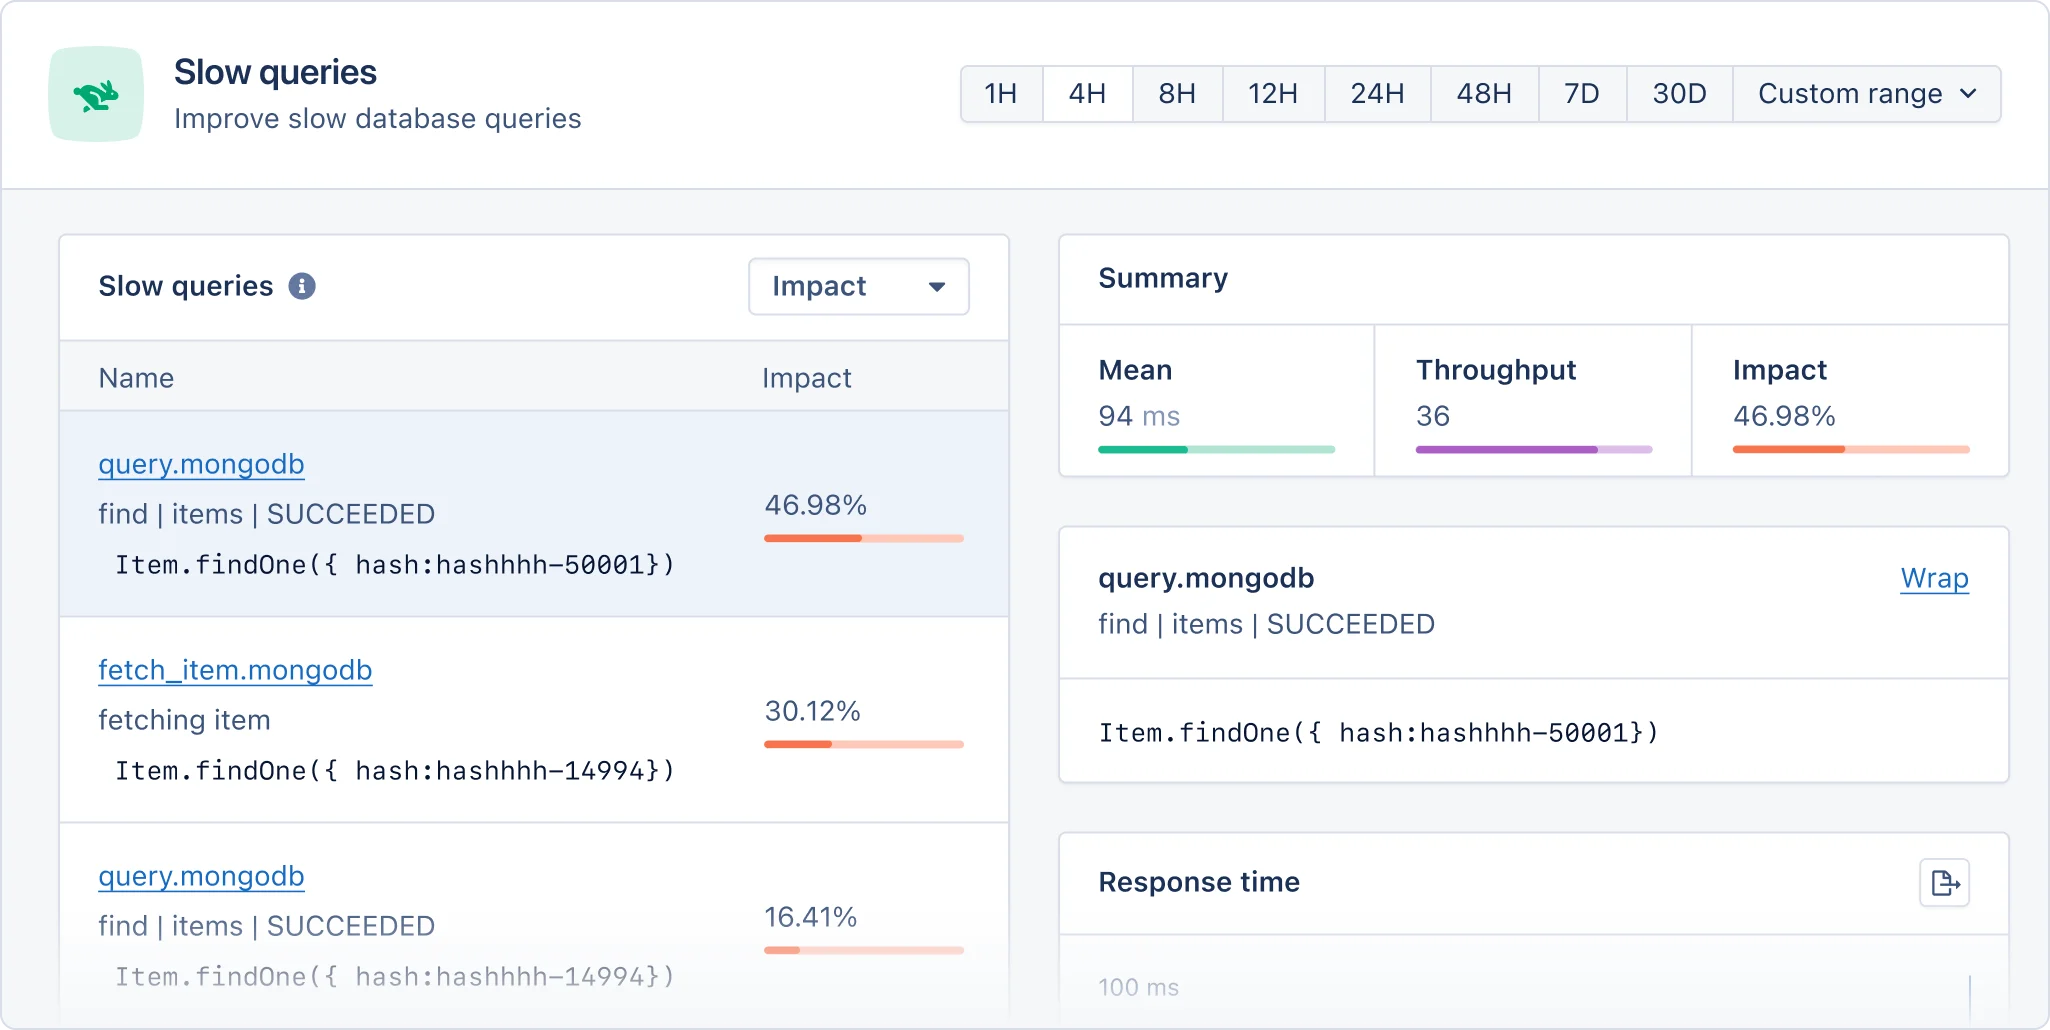
Wanneer AppSignal MongoDB-metrieken ontvangt, wordt er een MongoDB magic dashboard aangemaakt, beschikbaar in de dashboardsectie van de AppSignal-app.
Het MongoDB magic dashboard bevat de volgende grafieken:
| Grafiek | Metrieken | Tags |
| --------------------------------------- | ------------------------ | ---------- |
| [Throughput](#throughput-graph) | `mongodb_query_duration` | `database` |
| [Query duration](#query-duration-graph) | `mongodb_query_duration` | `database` |
Tags geven u een contextueel overzicht van de prestatie-informatie van Active job. Momenteel rapporteert AppSignal de volgende tags voor Active Job-jobs:
| Naam | Beschrijving |
| ---------- | --------------------------------------------------------- |
| `database` | Naam van de database waarvan de metriekdata afkomstig is. |
Elke tag wordt op de grafiek weergegeven met een gekleurde lijn:
## Magic dashboard
Wanneer AppSignal MongoDB-metrieken ontvangt, wordt er een MongoDB magic dashboard aangemaakt, beschikbaar in de dashboardsectie van de AppSignal-app.
Het MongoDB magic dashboard bevat de volgende grafieken:
| Grafiek | Metrieken | Tags |
| --------------------------------------- | ------------------------ | ---------- |
| [Throughput](#throughput-graph) | `mongodb_query_duration` | `database` |
| [Query duration](#query-duration-graph) | `mongodb_query_duration` | `database` |
Tags geven u een contextueel overzicht van de prestatie-informatie van Active job. Momenteel rapporteert AppSignal de volgende tags voor Active Job-jobs:
| Naam | Beschrijving |
| ---------- | --------------------------------------------------------- |
| `database` | Naam van de database waarvan de metriekdata afkomstig is. |
Elke tag wordt op de grafiek weergegeven met een gekleurde lijn:
 ### Throughput-grafiek
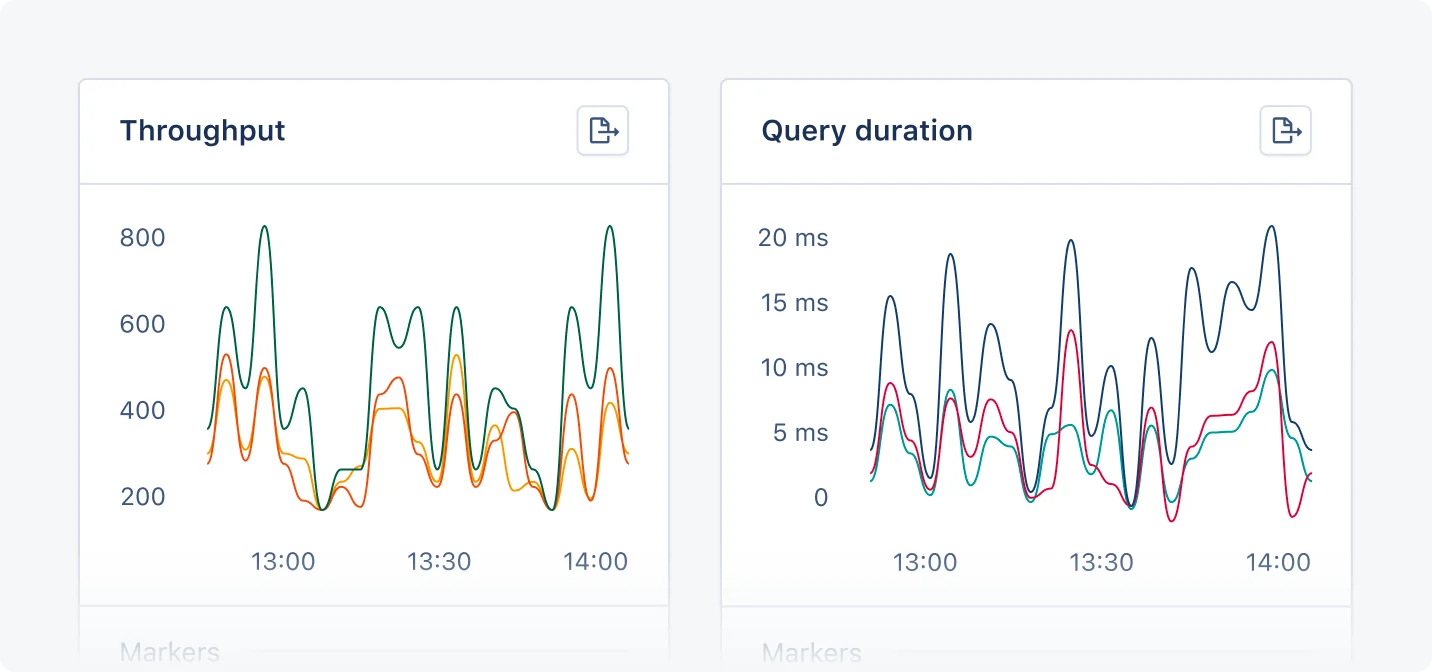
De Throughput-grafiek toont het aantal queries dat op elke MongoDB-database wordt uitgevoerd.
U kunt deze grafiek gebruiken om te begrijpen hoeveel queries de databases van uw app verwerken, om inefficiënte queries op te sporen en potentiële n+1- en schaalproblemen te identificeren.
### Query duration-grafiek
De Query duration-grafiek toont de 95e percentiel en de gemiddelde duur van de queries die op elke MongoDB-database worden uitgevoerd.
U kunt deze grafiek gebruiken om de prestaties van databasequeries te begrijpen, prestatieproblemen op te sporen en trage queries fijn te tunen.
[Mongoid]: https://github.com/mongodb/mongoid
[Mongo Ruby Driver]: https://github.com/mongodb/mongo-ruby-driver
### Throughput-grafiek
De Throughput-grafiek toont het aantal queries dat op elke MongoDB-database wordt uitgevoerd.
U kunt deze grafiek gebruiken om te begrijpen hoeveel queries de databases van uw app verwerken, om inefficiënte queries op te sporen en potentiële n+1- en schaalproblemen te identificeren.
### Query duration-grafiek
De Query duration-grafiek toont de 95e percentiel en de gemiddelde duur van de queries die op elke MongoDB-database worden uitgevoerd.
U kunt deze grafiek gebruiken om de prestaties van databasequeries te begrijpen, prestatieproblemen op te sporen en trage queries fijn te tunen.
[Mongoid]: https://github.com/mongodb/mongoid
[Mongo Ruby Driver]: https://github.com/mongodb/mongo-ruby-driver