> ## Documentation Index
> Fetch the complete documentation index at: https://docs.appsignal.com/llms.txt
> Use this file to discover all available pages before exploring further.
# NGINX metrics
The AppSignal integrations and the AppSignal stand-alone agent can generate metrics from your NGINX server's access logs. After configuring your NGINX server to send metrics to AppSignal, a magic dashboard with metrics related to your NGINX server will appear.
## Configuring AppSignal
First, you must configure your AppSignal integration or stand-alone agent to receive metrics from NGINX.
Enabling NGINX metrics will open a server for NGINX to send metrics to. By default, this server is bound to `localhost` and listens on port `27649`. You can modify these settings using the `bind_address` and `nginx_port` configuration options.
If you are running several AppSignal-instrumented applications at a time in the same server, you can configure each application to listen on a different port using the `nginx_port` configuration option.
If you configure your AppSignal integration with environment variables, you must set `APPSIGNAL_ENABLE_NGINX_METRICS` to true.
If you configure your AppSignal integration with configuration files, or you use the stand-alone agent, you can follow the relevant instructions below on how to enable NGINX metrics for your application:
* [Ruby configuration](#ruby)
* [Elixir configuration](#elixir)
* [Node.js configuration](#nodejs)
* [Stand-alone Agent configuration](#standalone-agent)
### Ruby
Support for NGINX metrics was added in version `3.3.4` of the Ruby
integration.
Add `enable_nginx_metrics: true` to the desired environment in your application's`config/appsignal.yml` file, for example the production environment:
```yaml YAML theme={null}
production:
enable_nginx_metrics: true
# ...
```
### Elixir
Support for NGINX metrics was added in version `2.5.2` of the Elixir
integration.
Add `enable_nginx_metrics: true` to your AppSignal configuration block, usually located at `config/config.exs`:
```elixir Elixir theme={null}
config :appsignal, :config,
enable_nginx_metrics: true,
# ...
```
### Node.js
Support for NGINX metrics was added in version `3.0.8` of the Node.js
integration.
Add `enableNginxMetrics: true` to your `appsignal.cjs` file:
```javascript Node.js theme={null}
new Appsignal({
enableNginxMetrics: true,
// ...
});
```
### Stand-alone agent
Support for NGINX metrics was added in version `0.0.24` of the stand-alone
agent.
Add `enable_nginx_metrics = true` to your `/etc/appsignal-agent.conf` configuration file:
```toml TOML theme={null}
enable_nginx_metrics = true
```
## Configuring NGINX
The next step is configuring your NGINX server to send metrics to AppSignal. In most Linux distributions, the default NGINX configuration will include configuration files from a configuration folder, often located in `/etc/nginx/conf.d`. Save the following configuration to that folder as `appsignal-metrics.conf`:
```nginx NGINX theme={null}
map '' $appsignal_group {
default 'http';
}
log_format appsignal_metrics '1|g=$appsignal_group;s=$status;rqt=$request_time;rql=$request_length;bs=$bytes_sent;ua=$upstream_addr;uct=$upstream_connect_time;uht=$upstream_header_time;urst=$upstream_response_time;us=$upstream_status;ucs=$upstream_cache_status;ca=$connections_active;cr=$connections_reading;cwr=$connections_writing;cwa=$connections_waiting';
access_log syslog:server=127.0.0.1:27649,tag=appsignal_nginx appsignal_metrics;
```
Replace `127.0.0.1:27649` with the host and port where your AppSignal integration or stand-alone agent is listening for NGINX metrics.
If your NGINX configuration does not include configuration files as described above, you can include it yourself from within the `http` block of your `nginx.conf` file:
```nginx NGINX theme={null}
http {
include '/path/to/appsignal-metrics.conf';
...
}
```
Note that if a `server` or `location` block contains an `access_log` directive, metrics for requests to that server or location will not be reported to AppSignal. To report metrics to AppSignal for those requests, you will need to add the following line inside the block:
```sh Shell theme={null}
access_log syslog:server=127.0.0.1:27649,tag=appsignal_nginx appsignal_metrics;
```
Replace `127.0.0.1:27649` with the host and port where your AppSignal integration or stand-alone agent is listening for NGINX metrics.
The existing `access_log` directive inside the block will continue to work as before.
### Configuring request groups
By changing the value of the `$appsignal_group` variable within a `location` or `server` block in your NGINX configuration, you can differentiate between different kinds of requests handled by your NGINX server:
```nginx NGINX theme={null}
location /admin {
set $appsignal_group 'admin';
...
}
```
Metrics related to requests will be segmented by their group, and the different groups will be tracked independently in the magic dashboard graphs for those metrics.
### Disabling metrics
You can use the `access_log off` directive to disable all access logs within a `location` or `server` block. Note that this will disable *all* access logs configured, not just those that are sent to AppSignal as metrics.
To only report metrics from specific `location` or `server` blocks, remove the following line from the `appsignal-metrics.conf` file, then add it only inside the specific `location` or `server` blocks that you would like to report metrics to AppSignal from:
```nginx NGINX theme={null}
access_log syslog:server=127.0.0.1:27649,tag=appsignal_nginx appsignal_metrics;
```
Replace `127.0.0.1:27649` with the host and port where your AppSignal integration or stand-alone agent is listening for NGINX metrics.
Doing this will implicitly disable all access logs from `access_log` directives in the surrounding `server` or `http` block. To enable those access logs again, repeat their corresponding `access_log` directive inside the `location` or `server` block that you added the above line to:
```nginx NGINX theme={null}
server {
access_log /var/log/nginx/access.log main;
location /app {
# this line enables AppSignal NGINX metrics for this location
# but it also disables the access log declared in the server block
access_log syslog:server=127.0.0.1:27649,tag=appsignal_nginx appsignal_metrics;
# this line enables the access log declared in the server block again
access_log /var/log/nginx/access.log main;
}
}
```
## Magic dashboard
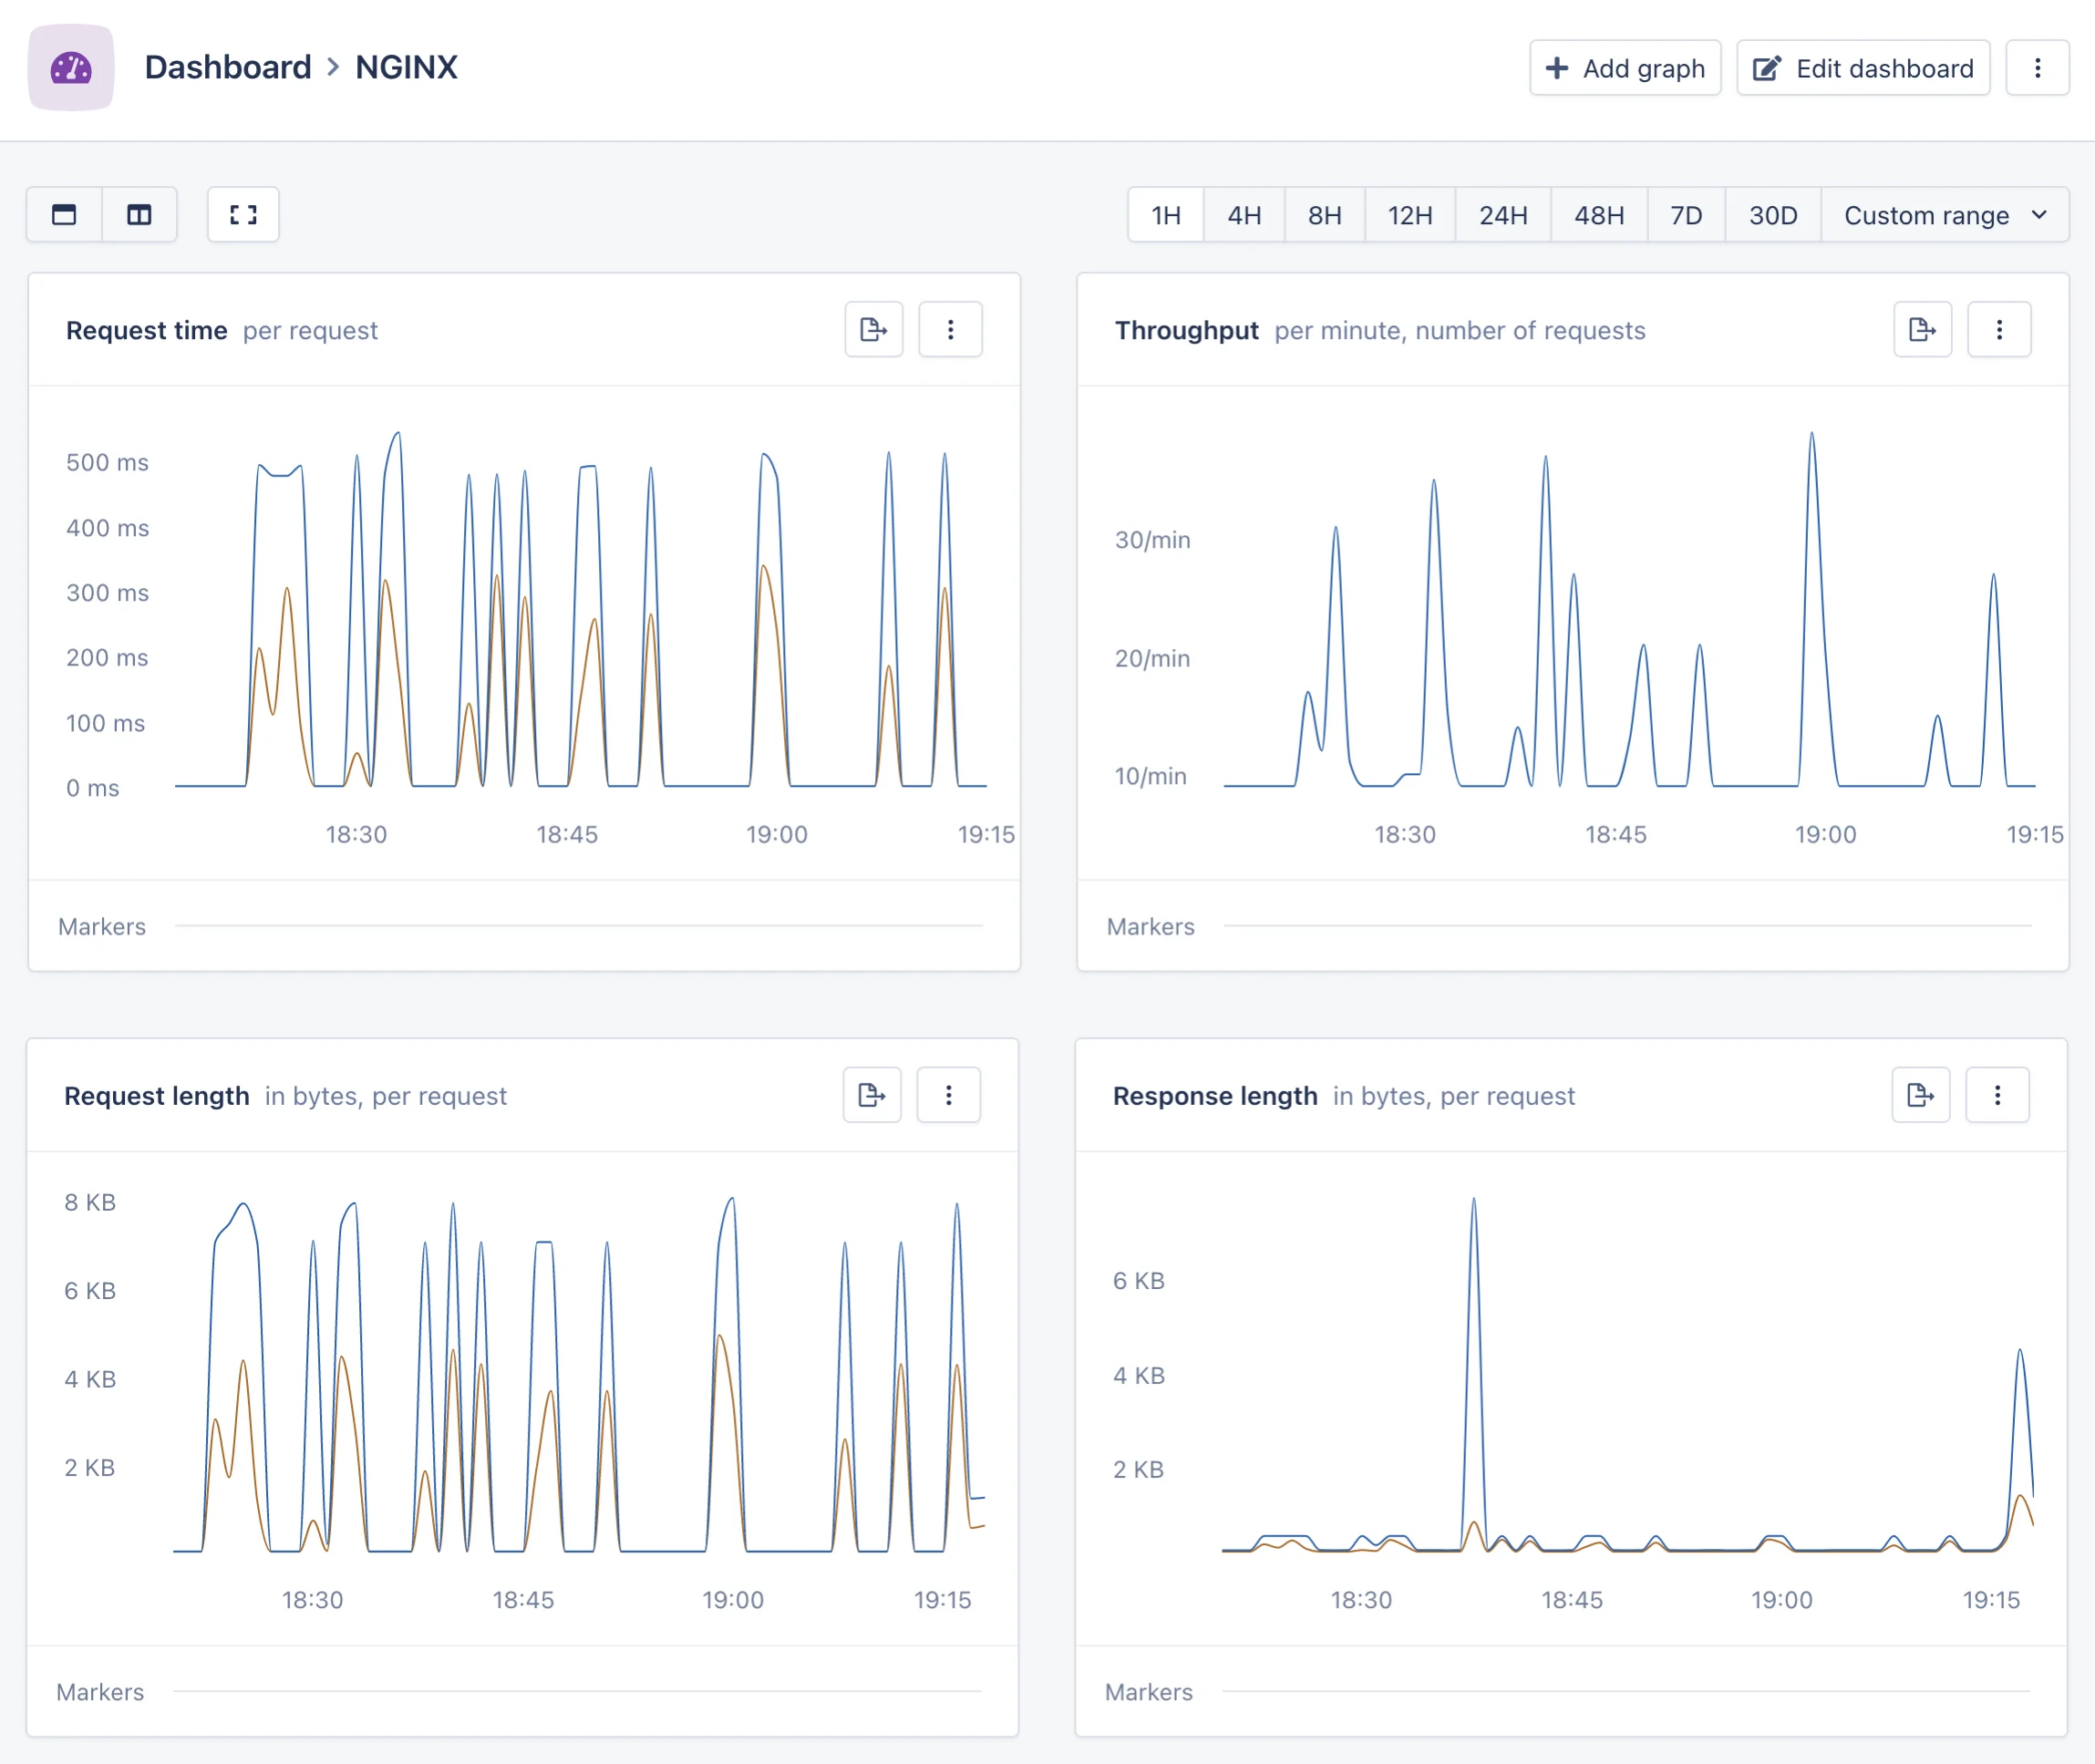 The [metrics sent to AppSignal by your NGINX server](#metrics) will be used to create a magic dashboard. In this dashboard, you will be able to see graphs representing useful metrics over time, such as:
* **Request time:** the time taken by your NGINX server to respond to a request, as a per-minute mean and 95th percentile.
* **Throughput:** a count of the requests handled by your NGINX server.
* **Request length:** the length in bytes of the request received from the client by your NGINX server, as a per-minute mean and 95th percentile.
* **Response length:** the length in bytes of the response sent to the client by your NGINX server, as a per-minute mean and 95th percentile.
* **Status codes:** a count of the status codes of the responses sent by your NGINX server.
* **Connections:** a gauge of the connections currently being handled by your NGINX server, measured once per minute and segmented by the status of the connection.
* **Upstream status codes:** a count of the status codes of the responses sent by the upstream servers that your NGINX server proxies from.
* **Upstream response time:** the time taken to respond to a request by the upstream servers that your NGINX server proxies from, as a per-minute mean and 95th percentile.
* **Upstream cache status:** the status of the cache (such as `HIT` or `MISS`) when handling a cached request proxied from an upstream server.
Most of these graphs are segmented by [the request group](#configuring-request-groups), the hostname or the relevant upstream, if any. You can, however, dive in to the graph editor and pick a different segmentation that provides a more useful view into your data. See the section below for a detailed breakdown of the metrics sent from your NGINX server.
## Metrics
The following metrics will be sent to AppSignal from your NGINX server:
* **`nginx_status`**: A counter incrementing for each request handled by your NGINX server. Tagged by:
* `status`: The status code of the response.
* `group`: The request group, as [configured in your NGINX server](#configuring-request-groups).
* `hostname`: The hostname of the server that handled the request.
* **`nginx_request_time`**: A distribution of the time taken to respond to each request. Tagged by:
* **`group`**: The request group, as [configured in your NGINX server](#configuring-request-groups).
* **`hostname`**: The hostname of the server that handled the request.
* `nginx_request_length`: A distribution of the bytes received in the request from the client, for each request. Tagged by:
* **`group`**: The request group, as [configured in your NGINX server](#configuring-request-groups).
* **`hostname`**: The hostname of the server that handled the request.
* `nginx_bytes_sent`: A distribution of the bytes sent in the response to the client, for each request. Tagged by:
* **`group`**: The request group, as [configured in your NGINX server](#configuring-request-groups).
* **`hostname`**: The hostname of the server that handled the request.
If the request is handled by proxying from an upstream using the `proxy_pass` NGINX directive, the following metrics will also be present:
* `nginx_upstream_time`: A distribution of the time it took to communicate with the upstream server. Tagged by:
* **`group`**: The request group, as [configured in your NGINX server](#configuring-request-groups).
* **`hostname`**: The hostname of the server that handled the request.
* **`upstream`**: The upstream server that the request was proxied to.
* **`measurement`**: The specific time measured:
* `connect`: The time it took for the connection to be established.
* `header`: The time it took for the response header to be sent.
* `response`: The time it took for the full response to be sent.
* `nginx_upstream_status`: A counter incrementing for each request proxied to an upstream. Tagged by:
* **`status`**: The status code of the response.
* **`group`**: The request group, as [configured in your NGINX server](#configuring-request-groups).
* **`hostname`**: The hostname of the server that handled the request.
* **`upstream`**: The upstream server that the request was proxied to.
If the request proxied from an upstream is cached using the `proxy_cache` NGINX directive, the following metric will also be present:
* `nginx_upstream_cache_status`: A counter incrementing for each request proxied to an upstream with caching enabled. Tagged by:
* **`status`**: The [cache status](http://nginx.org/en/docs/http/ngx_http_upstream_module.html#var_upstream_cache_status) for the request.
* **`group`**: The request group, as [configured in your NGINX server](#configuring-request-groups).
* **`hostname`**: The hostname of the server that handled the request.
If your NGINX server has been built with the `ngx_http_stub_status_module` NGINX module enabled (as provided by most Linux distributions) then the following metric will also be present:
* `nginx_connections`: The number of connections that your NGINX server is currently handling. Tagged by:
* **`hostname`**: The hostname of the server that handled the request.
* **`measurement`**: The specific number of connections measured:
* `active`: The number of active connections.
* `reading`: The number of connections where the request is being read.
* `writing`: The number of connections where the response is being written.
* `waiting`: The number of idle connections.
The connections metric always refers to the hostname as a whole, not to a specific group. Its value is updated once per minute.
The server hostname used for the metrics is not the NGINX hostname value, but
the hostname value configured for the AppSignal integration or standalone
agent. This value is usually configured automatically, and can be overriden by
the `hostname` configuration option.
## Support
If you are experiencing any difficulties configuring your application's NGINX metrics, [contact support](mailto:support@appsignal.com), and we'll help you get your metrics flowing.
The [metrics sent to AppSignal by your NGINX server](#metrics) will be used to create a magic dashboard. In this dashboard, you will be able to see graphs representing useful metrics over time, such as:
* **Request time:** the time taken by your NGINX server to respond to a request, as a per-minute mean and 95th percentile.
* **Throughput:** a count of the requests handled by your NGINX server.
* **Request length:** the length in bytes of the request received from the client by your NGINX server, as a per-minute mean and 95th percentile.
* **Response length:** the length in bytes of the response sent to the client by your NGINX server, as a per-minute mean and 95th percentile.
* **Status codes:** a count of the status codes of the responses sent by your NGINX server.
* **Connections:** a gauge of the connections currently being handled by your NGINX server, measured once per minute and segmented by the status of the connection.
* **Upstream status codes:** a count of the status codes of the responses sent by the upstream servers that your NGINX server proxies from.
* **Upstream response time:** the time taken to respond to a request by the upstream servers that your NGINX server proxies from, as a per-minute mean and 95th percentile.
* **Upstream cache status:** the status of the cache (such as `HIT` or `MISS`) when handling a cached request proxied from an upstream server.
Most of these graphs are segmented by [the request group](#configuring-request-groups), the hostname or the relevant upstream, if any. You can, however, dive in to the graph editor and pick a different segmentation that provides a more useful view into your data. See the section below for a detailed breakdown of the metrics sent from your NGINX server.
## Metrics
The following metrics will be sent to AppSignal from your NGINX server:
* **`nginx_status`**: A counter incrementing for each request handled by your NGINX server. Tagged by:
* `status`: The status code of the response.
* `group`: The request group, as [configured in your NGINX server](#configuring-request-groups).
* `hostname`: The hostname of the server that handled the request.
* **`nginx_request_time`**: A distribution of the time taken to respond to each request. Tagged by:
* **`group`**: The request group, as [configured in your NGINX server](#configuring-request-groups).
* **`hostname`**: The hostname of the server that handled the request.
* `nginx_request_length`: A distribution of the bytes received in the request from the client, for each request. Tagged by:
* **`group`**: The request group, as [configured in your NGINX server](#configuring-request-groups).
* **`hostname`**: The hostname of the server that handled the request.
* `nginx_bytes_sent`: A distribution of the bytes sent in the response to the client, for each request. Tagged by:
* **`group`**: The request group, as [configured in your NGINX server](#configuring-request-groups).
* **`hostname`**: The hostname of the server that handled the request.
If the request is handled by proxying from an upstream using the `proxy_pass` NGINX directive, the following metrics will also be present:
* `nginx_upstream_time`: A distribution of the time it took to communicate with the upstream server. Tagged by:
* **`group`**: The request group, as [configured in your NGINX server](#configuring-request-groups).
* **`hostname`**: The hostname of the server that handled the request.
* **`upstream`**: The upstream server that the request was proxied to.
* **`measurement`**: The specific time measured:
* `connect`: The time it took for the connection to be established.
* `header`: The time it took for the response header to be sent.
* `response`: The time it took for the full response to be sent.
* `nginx_upstream_status`: A counter incrementing for each request proxied to an upstream. Tagged by:
* **`status`**: The status code of the response.
* **`group`**: The request group, as [configured in your NGINX server](#configuring-request-groups).
* **`hostname`**: The hostname of the server that handled the request.
* **`upstream`**: The upstream server that the request was proxied to.
If the request proxied from an upstream is cached using the `proxy_cache` NGINX directive, the following metric will also be present:
* `nginx_upstream_cache_status`: A counter incrementing for each request proxied to an upstream with caching enabled. Tagged by:
* **`status`**: The [cache status](http://nginx.org/en/docs/http/ngx_http_upstream_module.html#var_upstream_cache_status) for the request.
* **`group`**: The request group, as [configured in your NGINX server](#configuring-request-groups).
* **`hostname`**: The hostname of the server that handled the request.
If your NGINX server has been built with the `ngx_http_stub_status_module` NGINX module enabled (as provided by most Linux distributions) then the following metric will also be present:
* `nginx_connections`: The number of connections that your NGINX server is currently handling. Tagged by:
* **`hostname`**: The hostname of the server that handled the request.
* **`measurement`**: The specific number of connections measured:
* `active`: The number of active connections.
* `reading`: The number of connections where the request is being read.
* `writing`: The number of connections where the response is being written.
* `waiting`: The number of idle connections.
The connections metric always refers to the hostname as a whole, not to a specific group. Its value is updated once per minute.
The server hostname used for the metrics is not the NGINX hostname value, but
the hostname value configured for the AppSignal integration or standalone
agent. This value is usually configured automatically, and can be overriden by
the `hostname` configuration option.
## Support
If you are experiencing any difficulties configuring your application's NGINX metrics, [contact support](mailto:support@appsignal.com), and we'll help you get your metrics flowing.