> ## Documentation Index
> Fetch the complete documentation index at: https://docs.appsignal.com/llms.txt
> Use this file to discover all available pages before exploring further.
# Kubernetes metrics
**Note**: This documentation is for the 0.x Intelligence dashboard-based version
of the Kubernetes integration. For the latest installation guide, refer to our
[Kubernetes 1.x documentation](/kubernetes/metrics).
The [AppSignal for Kubernetes](https://github.com/appsignal/appsignal-kubernetes) integration extracts metrics from Kubernetes clusters.
After adding the AppSignal Kubernetes deployment to your cluster, an [Intelligence dashboard with Kubernetes metrics](#intelligence-dashboard) will be created, showing an overview of node and pod metrics.
## Installation
To start reporting Kubernetes cluster metrics to AppSignal:
1. [Store your AppSignal API key in a secret](#1-store-your-appsignal-api-key-in-a-secret)
2. [Add AppSignal deployment to your cluster](#2-add-appsignal-deployment-to-your-cluster)
### 1. Store your AppSignal API key in a secret
In a Kubernetes cluster, set up your AppSignal API key (find your *Front-end* API key in [App settings](https://appsignal.com/redirect-to/app?to=info)) by creating a secret:
```bash Bash theme={null}
kubectl create secret generic appsignal --from-literal=api-key=
```
### 2. Add AppSignal deployment to your cluster
Once you've created the AppSignal API key secret, add the AppSignal deployment to your cluster:
```bash Bash theme={null}
kubectl apply -f https://raw.githubusercontent.com/appsignal/appsignal-kubernetes/v0.2.0/deployment.yaml
```
Once configured, AppSignal for Kubernetes will start reporting Kubernetes metrics automatically.
## Intelligence dashboard
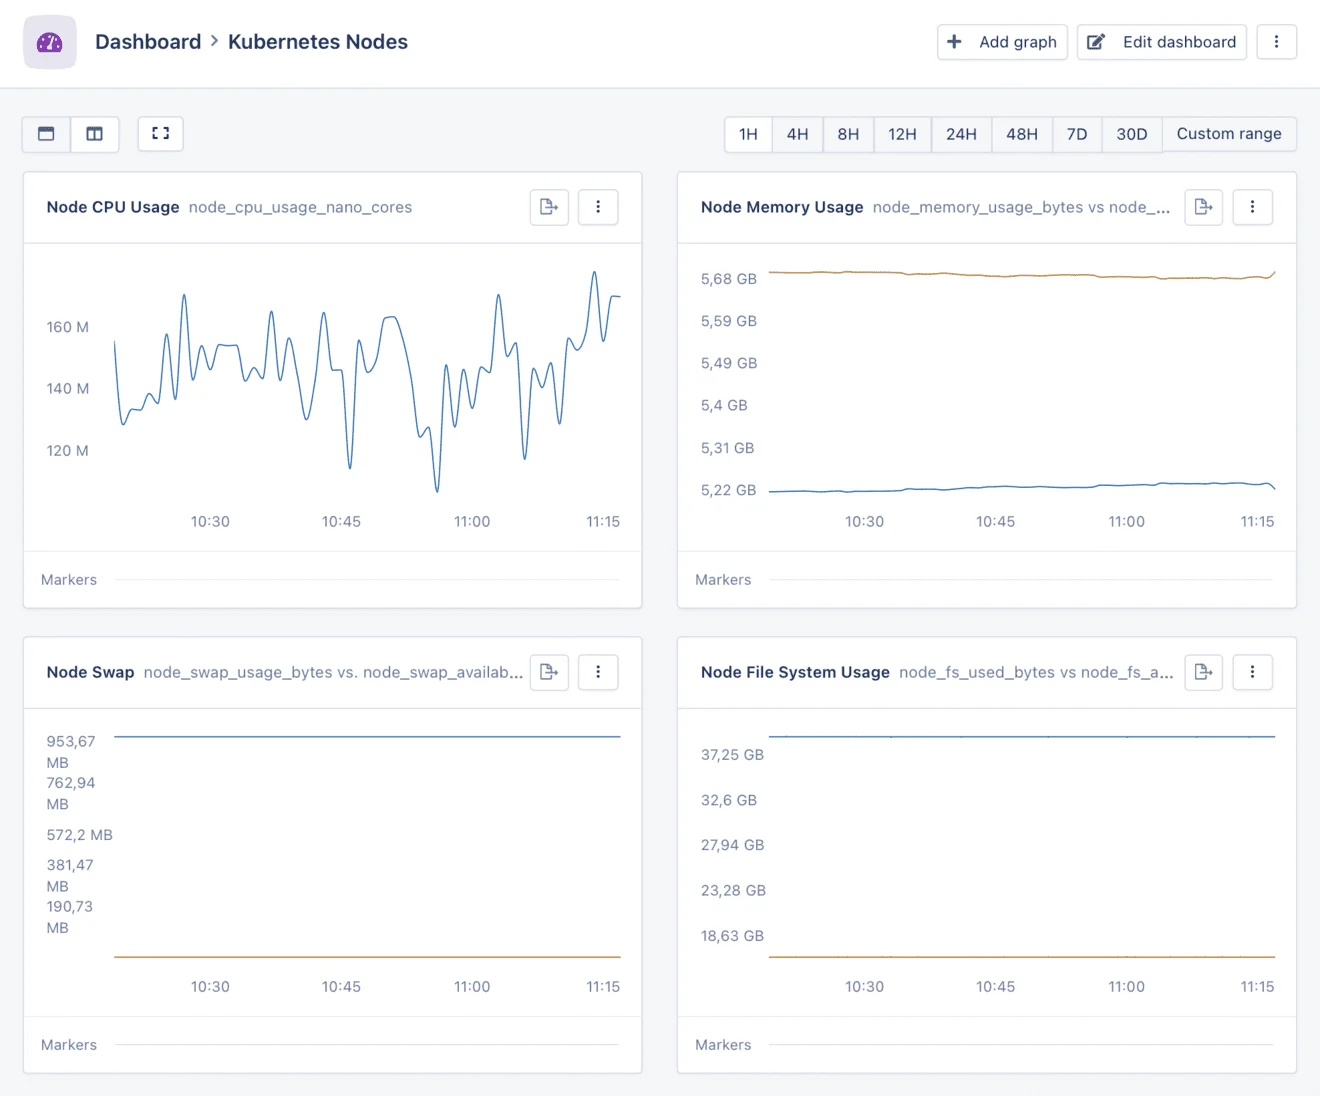
Your [Kubernetes metrics](#metrics) will be used to create two Intelligence dashboards.
In both dashboards, you will be able to see graphs representing useful metrics over time, such as:
* **CPU Usage:** CPU usage stats per node or pod
* **Memory Usage:** memory usage statistics, comparing the used memory to what's available per node or pod
* **Swap Usage:** swap usage statistics, comparing the used swap to what's available per node or pod
* **Disk Usage:** disk usage statistics, comparing the used disk space to what's available per node
* **Network usage:** network usage, split by received and transmitted bytes per node
Below is an example of an automated Kubernetes dashboard:
 ## Metrics
AppSignal for Kubernetes extracts the following metrics from the `/api/v1/nodes//proxy/stats/summary` endpoint:
### Node metrics
* `node_cpu_usage_nano_cores`
* `node_cpu_usage_core_nano_seconds`
* `node_memory_usage_bytes`
* `node_memory_working_set_bytes`
* `node_memory_rss_bytes`
* `node_memory_page_faults`
* `node_memory_major_page_faults`
* `node_network_rx_bytes`
* `node_network_rx_errors`
* `node_network_tx_bytes`
* `node_network_tx_errors`
* `node_fs_available_bytes`
* `node_s_capacity_bytes`
* `node_fs_inodes_free`
* `node_fs_inodes`
* `node_fs_inodes_used`
* `node_rlimit_maxpid`
* `node_rlimit_curproc`
* `node_swap_available_bytes`
* `node_swap_usage_bytes`
### Pod metrics
* `pod_cpu_usage_nano_cores`
* `pod_cpu_usage_core_nano_seconds`
* `pod_memory_working_set_bytes`
* `pod_swap_available_bytes`
* `pod_swap_usage_bytes`
You can track any of these metrics with a [custom dashboard](https://docs.appsignal.com/metrics/dashboards.html).
## Disabling host metrics
The Kubernetes dashboards serve as a replacement for [AppSignal's host metrics](https://docs.appsignal.com/metrics/host-metrics.html), and will eventually replace them altogether.
In the meantime, we recommend disabling host metrics for Kubernetes setups by setting [the `enable_host_metrics` configuration](https://docs.appsignal.com/ruby/configuration/options.html#option-enable_host_metrics) to `false`.
## Support
If you are experiencing any difficulties configuring your application's Kubernetes metrics, [contact support](mailto:support@appsignal.com), and we'll help you get your metrics flowing.
## Metrics
AppSignal for Kubernetes extracts the following metrics from the `/api/v1/nodes//proxy/stats/summary` endpoint:
### Node metrics
* `node_cpu_usage_nano_cores`
* `node_cpu_usage_core_nano_seconds`
* `node_memory_usage_bytes`
* `node_memory_working_set_bytes`
* `node_memory_rss_bytes`
* `node_memory_page_faults`
* `node_memory_major_page_faults`
* `node_network_rx_bytes`
* `node_network_rx_errors`
* `node_network_tx_bytes`
* `node_network_tx_errors`
* `node_fs_available_bytes`
* `node_s_capacity_bytes`
* `node_fs_inodes_free`
* `node_fs_inodes`
* `node_fs_inodes_used`
* `node_rlimit_maxpid`
* `node_rlimit_curproc`
* `node_swap_available_bytes`
* `node_swap_usage_bytes`
### Pod metrics
* `pod_cpu_usage_nano_cores`
* `pod_cpu_usage_core_nano_seconds`
* `pod_memory_working_set_bytes`
* `pod_swap_available_bytes`
* `pod_swap_usage_bytes`
You can track any of these metrics with a [custom dashboard](https://docs.appsignal.com/metrics/dashboards.html).
## Disabling host metrics
The Kubernetes dashboards serve as a replacement for [AppSignal's host metrics](https://docs.appsignal.com/metrics/host-metrics.html), and will eventually replace them altogether.
In the meantime, we recommend disabling host metrics for Kubernetes setups by setting [the `enable_host_metrics` configuration](https://docs.appsignal.com/ruby/configuration/options.html#option-enable_host_metrics) to `false`.
## Support
If you are experiencing any difficulties configuring your application's Kubernetes metrics, [contact support](mailto:support@appsignal.com), and we'll help you get your metrics flowing.