> ## Documentation Index
> Fetch the complete documentation index at: https://docs.appsignal.com/llms.txt
> Use this file to discover all available pages before exploring further.
# Apdex
> Score how satisfied your users are with your app's response times, per namespace.
Apdex (Application Performance Index) turns response times into a single score between 0 and 1. A score of 1 means every request was fast enough. A score of 0 means every request was too slow.
You decide what "fast enough" means by setting two thresholds per [namespace](/application/namespaces). AppSignal reports the score as a metric and charts it on the Apdex page.
Apdex is an [AppSignal Labs](/labs) feature, currently in beta. It sits behind a feature flag, so contact [AppSignal support](mailto:support@appsignal.com) to have it enabled for your organization.
How Apdex rates requests
Apdex rates each request as satisfied, tolerating, or frustrated, based on the thresholds you set:
| Rating | Response time | Weight |
| ---------- | ------------------------------------------------------------- | ------ |
| Satisfied | At or below the satisfied threshold | 1 |
| Tolerating | Above the satisfied threshold, up to the tolerating threshold | 0.5 |
| Frustrated | Above the tolerating threshold | 0 |
The score is the weighted average of these counts. You set the satisfied and tolerating thresholds. Frustrated covers everything slower.
1. Open the [Apdex page](https://appsignal.com/redirect-to/app?to=performance/apdex) under Performance for your app.
2. Select a namespace without a configuration in the namespace filter.
3. Select **Configure Apdex**.
4. Choose the **Namespace** you want to score. The list holds every namespace that does not have a configuration yet.
5. Enter the **Satisfied threshold** and **Tolerating threshold** in milliseconds.
6. Select **Create configuration**.
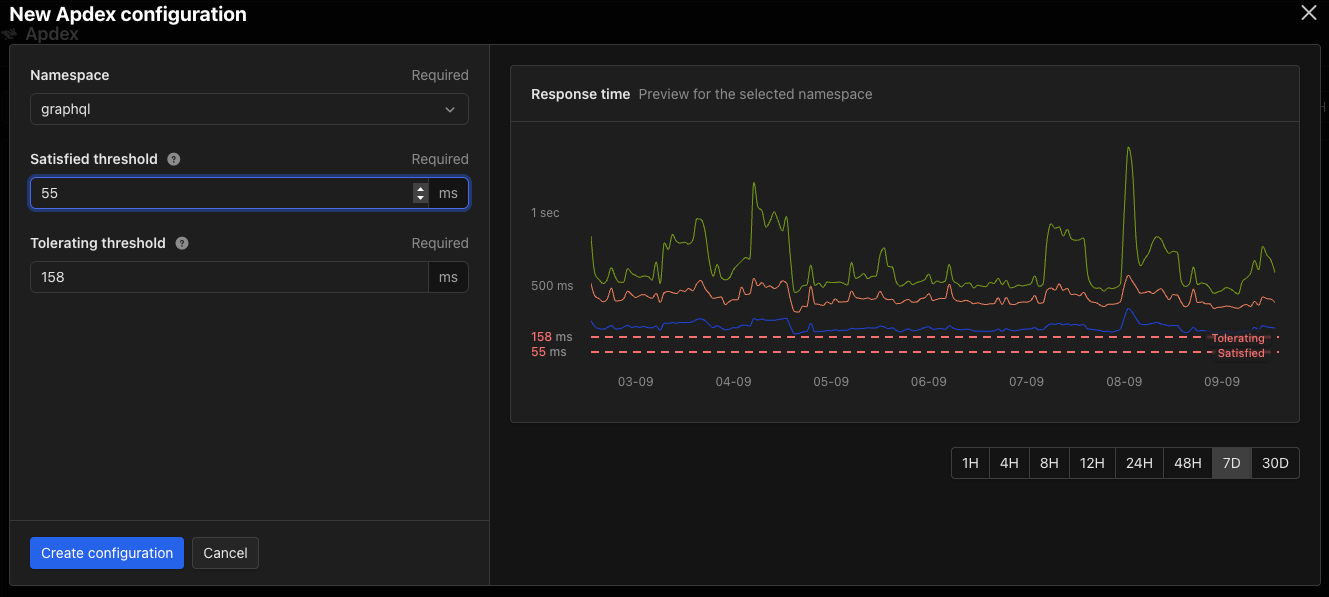 The form previews the namespace's mean, 90th percentile, and 95th percentile response times over the last seven days, and draws a line for each threshold as you enter it. Use it to set thresholds against the response times you already have. Change the preview's time range to read a shorter or longer period.
Each namespace can have one configuration. Repeat this for every namespace you want to score.
To change the thresholds later, select **Edit configuration**, then **Update**. The namespace is fixed when you edit a configuration.
When a namespace has no configuration, the page lists the other namespaces that do. This tells you whether Apdex is unconfigured for this namespace only, or for the whole app.
The form previews the namespace's mean, 90th percentile, and 95th percentile response times over the last seven days, and draws a line for each threshold as you enter it. Use it to set thresholds against the response times you already have. Change the preview's time range to read a shorter or longer period.
Each namespace can have one configuration. Repeat this for every namespace you want to score.
To change the thresholds later, select **Edit configuration**, then **Update**. The namespace is fixed when you edit a configuration.
When a namespace has no configuration, the page lists the other namespaces that do. This tells you whether Apdex is unconfigured for this namespace only, or for the whole app.
The Apdex page
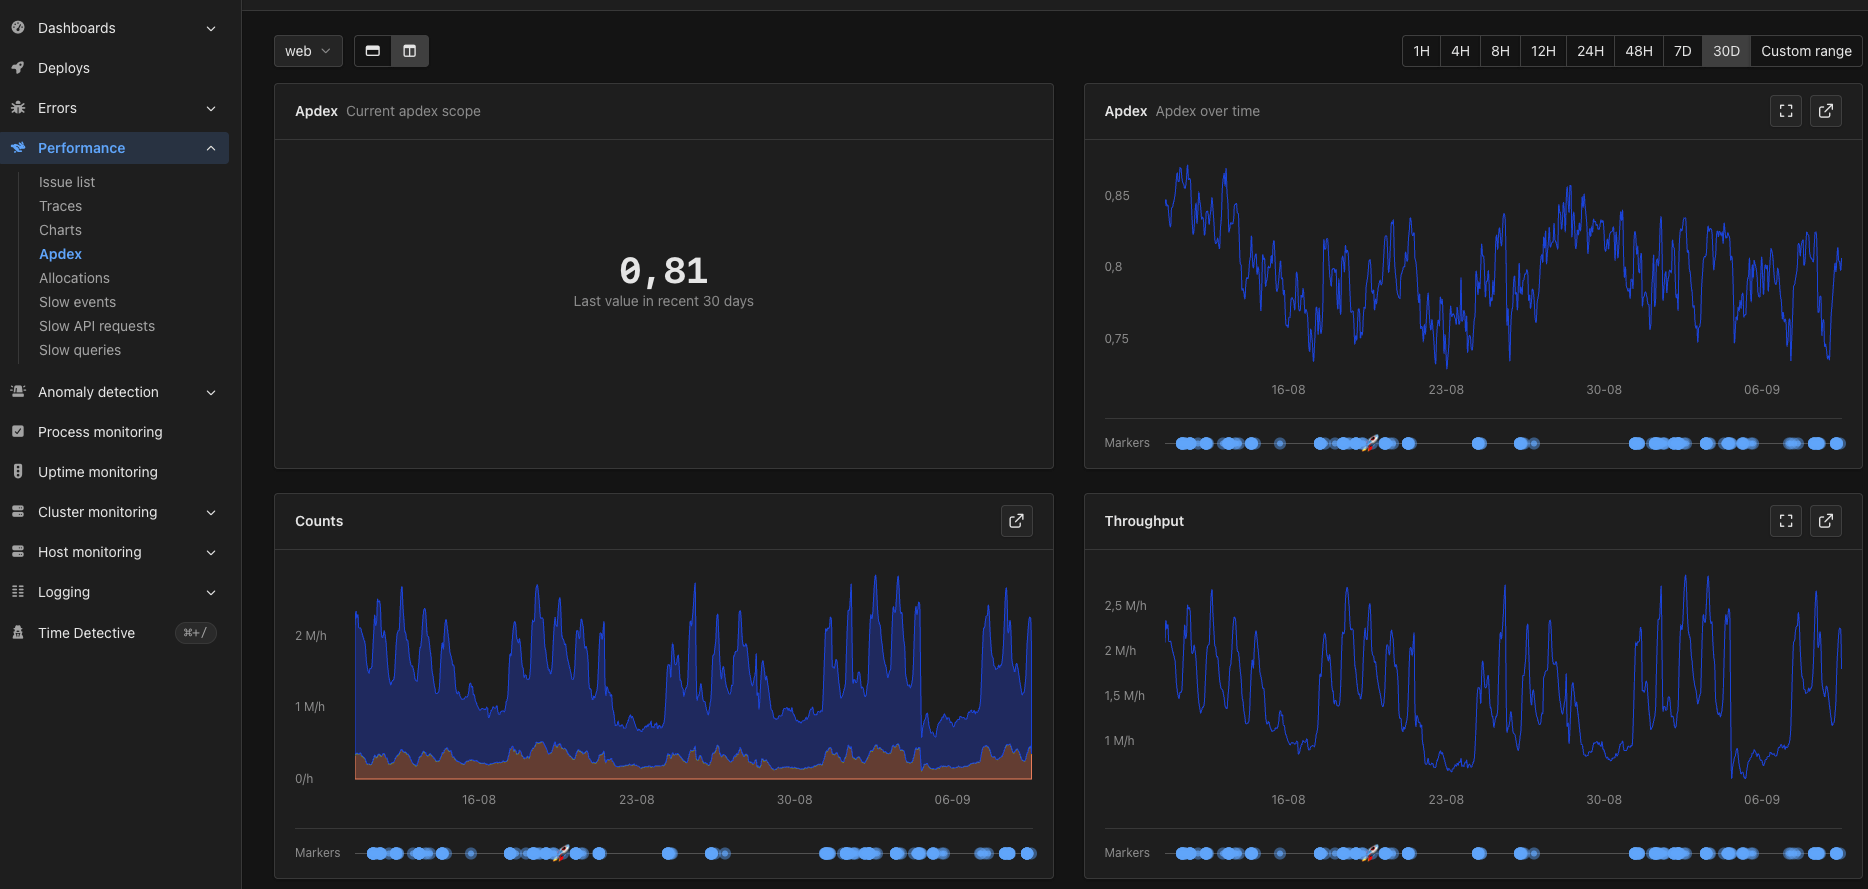 The Apdex page charts one namespace at a time. Use the filters to choose the namespace, set the time range, and switch between a one and two column layout.
The namespace filter lists every namespace in your app, not only the ones with Apdex configured. Selecting a namespace without a configuration shows the empty state, where you can configure it.
For a namespace with a configuration, the page charts:
* The latest Apdex score for the selected time range.
* The Apdex score over time.
* **Counts** — how many requests were satisfied, tolerating, and frustrated.
* **Throughput** — request throughput for the namespace.
* **Response time** — mean, 90th percentile, and 95th percentile response times for the namespace.
Throughput and response time are the same namespace metrics you see elsewhere in Performance. They are included here so you can read a score against the traffic and latency behind it.
The Apdex page charts one namespace at a time. Use the filters to choose the namespace, set the time range, and switch between a one and two column layout.
The namespace filter lists every namespace in your app, not only the ones with Apdex configured. Selecting a namespace without a configuration shows the empty state, where you can configure it.
For a namespace with a configuration, the page charts:
* The latest Apdex score for the selected time range.
* The Apdex score over time.
* **Counts** — how many requests were satisfied, tolerating, and frustrated.
* **Throughput** — request throughput for the namespace.
* **Response time** — mean, 90th percentile, and 95th percentile response times for the namespace.
Throughput and response time are the same namespace metrics you see elsewhere in Performance. They are included here so you can read a score against the traffic and latency behind it.
Apdex metrics
Once a namespace has a configuration, AppSignal reports two metrics for it:
* `apdex` — the score for the namespace, between 0 and 1.
* `apdex_counts` — how many requests were satisfied, tolerating, and frustrated. These are the numbers the score is calculated from.
Both metrics are reported per namespace. Charting `apdex_counts` gives you one series per rating, each named after the namespace it belongs to: `web - satisfied`, `web - tolerating`, and `web - frustrated`.
You can use both metrics like any other metric, on your own [dashboards](/metrics/dashboards) and in [anomaly detection triggers](/anomaly-detection).
Remove an Apdex configuration
Select the namespace in the filter, select **Edit configuration**, then **Delete configuration** and confirm.
AppSignal stops scoring the namespace. The `apdex` and `apdex_counts` metrics stop being reported for it, and the charts on the Apdex page fall back to the empty state.